Geology Reference
In-Depth Information
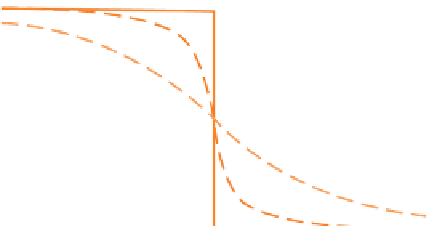
(a)
High initial
concentration of
i
Low initial
concentration of
i
(b)
T
/ °C
t
0
1400
1350
1300
t
2
t
1
c
i
-22
t
3
Basalt
t
∞
-24
Andesite
-26
Flux of ions
-28
0.60
0.62
0.64
x
10
3
/ K
-1
Section across sample
T
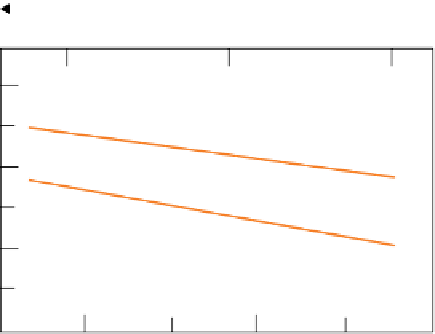
Figure 3.6
(a) The diffusion of ions in response to a non-uniform concentration distribution. (b) Arrhenius plot of diffusion
coefficients for the diffusion of cobalt ions in silicate melts. The activation energies measured from the slopes of the two graphs are:
basalt: 220 kJ mol
−1
andesite: 280 kJ mol
−1
The units of
D
are m
2
s
−1
. Temperature is expressed in kelvins (K). (Source: Adapted from Lowry
et al
. (1982).
Reproduced with permission from Springer Science and Business Media.)
randomly even through a homogeneous substance,
but only where a concentration gradient exists is a
net
flow of chemical components observed.
Imagine a crystal with an abrupt internal discont-
inuity in the concentration of a component
i
, as shown
in Figure 3.6a. Suppose the crystal is maintained at a
constant temperature
T,
high enough for solid-state
diffusion to occur at a significant rate. If we were to
measure the distribution of component
i
on several
successive occasions
t
1
,
t
2
,
t
3
, we would see the devel-
opment of a progressively smoother concentration
profile, leading eventually to a uniform distribution of
i
(at
t
∞
in Figure 3.6a). These changes point to a net flux
of component
i
from left to right through the plane of
the original discontinuity. The magnitude of the flux in
moles per second will depend on the surface area of
this interface. One therefore expresses the flux
f
i
as the
amount of component
i
(in
moles
) that migrates
through a unit area of the plane per second, so the
units are 'moles per square metre per second'
(mol m
−2
s
−1
). Common sense suggests that the flux will
depend upon the steepness of the concentration grad-
ient
d
d
uniform and the gradient zero, whereas a high flux
will occur if the gradient is steep. The 19th century
German physicist Adolf Fick backed up this hunch
theoretically in 1855, showing that:
f D
c
x
d
d
i
=−
(3.11)
i
i
This equation is known as
Fick's First Law of Diffusion
.
The negative sign indicates that the direction of the net
flux
f
i
is
down
the concentration gradient (i.e. towards
the right in Figure 3.6a). The constant
D
i
is called the
diffusion coefficient
for the species
i
in the crystal con-
cerned (at a given temperature). The units of concen-
tration
c
i
are 'moles per cubic metre' (mol m
−3
), so the
concentration gradient d
c
i
/d
x
will have units of moles
per cubic metre
per metre
in the
x
direction ([mol m
−3
]
m
−1
= mol m
−4
) from which it is simple to show that the
units of
D
i
must be m
2
s
−1
(see Exercise 3.5).
Many experimental determinations of diffusion
coefficients have been made for various elements in a
range of silicate materials at various temperatures.
Figure 3.6b shows how the measured diffusion
c
x
i
; so no net flux will occur if the concentration is


Search WWH ::

Custom Search