Geology Reference
In-Depth Information
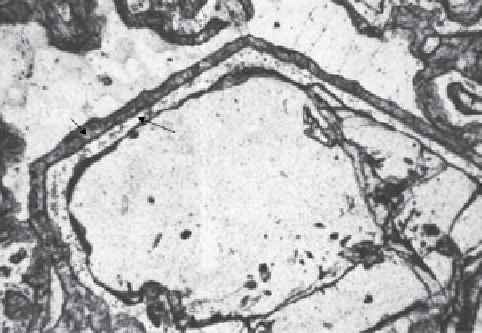
Box 3.1 Disequilibrium textures
Mineral reactions that are unable to proceed to comple-
tion leave a rock in a state of chemical disequilibrum
which, on the scale of a thin section, may be indicated by
a variety of disequilibrium textures.
Quartz
Pyroxene
Plag + magnetite
Coronas
Figure 3.1.1 shows a garnet crystal in a metamorphic rock
(a metagabbro) which, as conditions changed during meta-
morphism, became unstable and began to react with adja-
cent quartz crystals to form a mixture of new minerals:
plagioclase, magnetite (finely dispersed in the plagioclase)
and pyroxene. the products of this metamorphic reaction
are located at the periphery of the garnet crystal, in a
zonal arrangement known as a corona structure. a corona
records a mineral reaction that took place too slowly for it
to proceed to completion (i.e. complete elimination of the
garnet crystal) before changing conditions brought it to a
halt. the rates of such reactions are controlled by diffu-
sion rates and are therefore strongly temperature-depend-
ent. What remains is a frozen-in disequilibrium texture.
It is often impossible (as here) to represent a corona
reaction as a balanced chemical equation between the
minerals observed, owing to the involvement of a fluid (or
in some cases a melt) phase which can introduce and
remove soluble reaction components without leaving any
visible trace in Figure 3.1.1.
Garnet
Figure 3.1.1
Corona structure rimming a six-sided garnet
crystal in a metamorphosed gabbro. Opx and cpx stand
for ortho- and clinopyroxene respectively. Width of field
of view 4.5 mm. (Source: Carlson & Johnson, 1991,
reproduced with permission of the Mineralogical Society
of america.)
Reaction rims
Similar textures called reaction rims arise in various igne-
ous rocks, due to reaction between early-formed crystals
with later, more evolved melts. For example, olivine phe-
nocrysts may become mantled by orthopyroxene owing to
reaction with evolved melt richer in SiO
2
(plate 1; see
Defining the rate of a reaction
Imagine a laboratory experiment in which gaseous
NO and O
3
are reacted together in a sealed vessel
equipped with sensors that monitor the changing con-
centrations of NO, O
3
, NO
2
and O
2
in the reaction ves-
sel as the reaction progresses. (How these sensors
work need not concern us.) The reaction consumes
NO and O
3
, whose concentrations (
c
NO
and
c
O
3
, each
expressed in mol dm
−3
) therefore decrease with time as
shown in Figure 3.1. The concentrations of the prod-
ucts increase correspondingly as the reaction proceeds.
The
rate
of the reaction at any stage is the gradient
of the right-hand graph in Figure 3.1 at the moment
concerned. Borrowing the symbolism of calculus
(Appendix A):
It is easy to accept that some reactions proceed faster
than others, but less easy to see how such differences
can be expressed quantitatively. What precisely do we
mean by the
rate
of a reaction?
Consider a simple chemical reaction, for example
that between nitric oxide (NO) and ozone (a form of
oxygen molecule comprising three oxygen atoms, O
3
),
two gaseous pollutants that occur in the troposphere
as a result of the burning of fossil fuels. These
reactants
react with each other in equal molecular proportions to
form the
products
nitrogen
di
oxide (NO
2
) and ordi-
nary oxygen (O
2
), which are also gases:
NO O OO
3
+→ +
gas
d
c
d
d
c
2
(3.1)
2
NO
rate
=
= −
NO
(3.2)
2
gas
gas
gas
d
t
t


Search WWH ::

Custom Search