Geology Reference
In-Depth Information
(a) It is easy to see how straight a straight-line graph
is. It is much harder to judge the curvature that a
curved relationship should have.
(b) It is a simple calculation to determine the values of
the constants in the equation (e.g.
A
,
E
a
) from a
straight-line graph. (A linear relation between y
and c may be written
y = mx +
c, where
m
is the
gradient and
c
is the
y
-axis intercept.) It is harder to
extract the values of these constants from a curved
graph.
X
X
X
X
X
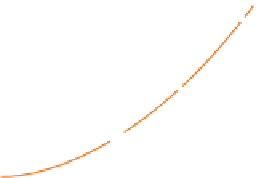
T
/K
Figure A3
Sketch of variation of rate constant with
temperature.
Significant figures
Consider an alternative plot. The Arrhenius equa-
tion may be written in a logarithmic form by taking
natural logs of both sides:
How many decimal places should be quoted, for exam-
ple when tabulating a chemical analysis? The answer
depends on the
precision
(reproducibility) of the anal-
ysis: a precise analysis will justify quoting more digits
(e.g. 8.465%) than a less precise analysis (e.g. 8.5%).
The number of digits that a measurement's precision
will support is called the
number of significant figures
.
The value 1.57623 has 6 significant figures, whereas
1.58 has only 3 significant figures.
The accepted practice in tabulating numerical data
(e.g. Table 8.4) is to give the number of significant fig-
ures that most closely represents the precision of the
data. For example, a mass spectrometer may print out
a Sr isotope ratio as 0.704249 but, if the measured preci-
sion is ±0.0005, the ratio is more truthfully reported as
0.7042.
There is no point in writing down more significant
figures than the precision of a measurement will sup-
port (although a poorly managed spreadsheet may
often do this); thus 1.569821 ± 0.0187 is more objec-
tively written as 1.57 ± 0.02.
When two numbers are combined in arithmetical
operations, the answer should be given the same sig-
nificant figures as the less precise component:
E
RT
ln
k A
=+ −
ln
ln exp
a
E
RT
(A11)
a
=−
(
=+
)
ln
A
ycmx
It is clear that when ln
k
is plotted against 1/
T
, the form
of this equation predicts a straight line, with slope
=−
E
R
a
and intercept = ln
A
(see Figure A4).
Thus there are two reasons for manipulating a
theoretical equation into linear form before attempting
to verify it against experimental results:
X
X
X
X
X
• 3.98595 + 3.2 should be written as 7.2, not 7.18595.
• 4.5 × 6.9877 = 31, not 31.4447.
• 0.79877 ÷ 2.9 = 0.28, not 0.27544.
1
T
/K
Further reading
Figure A4
Sketch showing the linear variation of the
logarithm
of rate constant
versus
inverse temperature
(in kelvins).
Waltham, D. (2000)
Mathematics: A Simple Tool for Geologists
,
2nd edition. Oxford: Blackwell Science.


Search WWH ::

Custom Search