Geology Reference
In-Depth Information
excites the atoms with which they collide in the
tiny volume of the sample directly under the area
of impact, from which the X-ray spectra of ele-
ments present in the sample are emitted. This is
the principle of the
electron microprobe
(Box 6.4),
widely used for the chemical analysis of mineral
crystals
in situ
in geological thin sections. The
microprobe can also be used to investigate chemical
variation
within
an individual crystal, such as
zon-
ing
(Plate 2) or exsolution (Plate 3).
(b) A powerful beam of X-rays (from an X-ray tube),
when directed at a sample in powdered or fused
form, will prompt X-ray emission in the sample by
fluorescence
. The photon energy of the incoming
('primary') X-rays,
E
q
, must be sufficient to eject
the relevant electrons from the sample atoms
(Figure 6.4a). The sample responds by emitting
'secondary' or 'fluorescent' X-ray spectra charac-
teristic of the elements present in the sample. X-ray
fluorescence spectrometry is an important rapid
method of whole-rock analysis (of homogeneous
samples in powdered or fused form), applicable to
major elements and many trace elements.
Photon energy /keV
10.0
5.0
2.0
1. 0
0.5
N shell
M shell
L shell
L
β
L
α
K
β
K
α
K shell
K
α
Fe
L
α
K
β
L
β
Zn
Cr Ti Ca
0.1
0.2
0.5
1. 0
Z
-dependence of X-ray spectra: Moseley's Law
One advantage of using X-ray spectra for rock and
mineral analysis is that element wavelengths depend
in a very simple way on the atomic number
Z.
Increasing the nuclear charge 'stretches' the energy
level structure downward in energy space, expanding
the energy differences Δ
E
between different levels.
This is easily seen from the energy scales in Figure 5.7.
It follows that the photon energy for a given transi-
tion - the Kα line, for example - increases with atomic
number, while the corresponding wavelength decreases
(Figure 6.5). This relationship is expressed in a simple
equation established empirically by the British physi-
cist H.G.J. Moseley in 1914 and known as
Moseley's
Law
:
2.0
λ
/nm
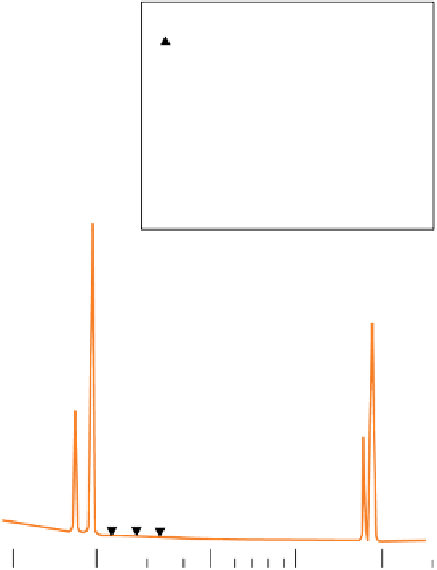
Figure 6.5
The X-ray spectrum of iron as shown by an X-ray
spectrometer. The inset shows the electron transitions
involved. The arrows in the main diagram show how K
α
wavelength shifts from element to element. The width of
the peaks has been exaggerated.
small. X-ray spectra therefore consist of relatively few
lines, a fact which makes them convenient for the anal-
ysis of complex, multi-element samples like rocks and
minerals, since superposition of lines is less probable.
In common with all atomic spectra, the wavelength of
each X-ray peak depends upon the atomic number of
the element emitting it (Figure 6.5).
The production of X-rays involves creating a vacancy
in the K or L shell by ejecting an electron completely
out of the atom (Figure 6.4). Two methods can be used
to excite atoms into generating X-ray spectra for ana-
lytical purposes:
1
2
λ
=−
(
)
kZ
σ
(6.1a)
Alternatively this may be written in terms of photon
energy
E
:
(a) A very narrow beam of high-energy electrons can
be focused on a small area on the surface of the
sample (usually a crystal on the surface of a pol-
ished thin section). The energy of the electrons
E
hc
(
σ
2
(6.1b)
k
=−


Search WWH ::

Custom Search