Environmental Engineering Reference
In-Depth Information
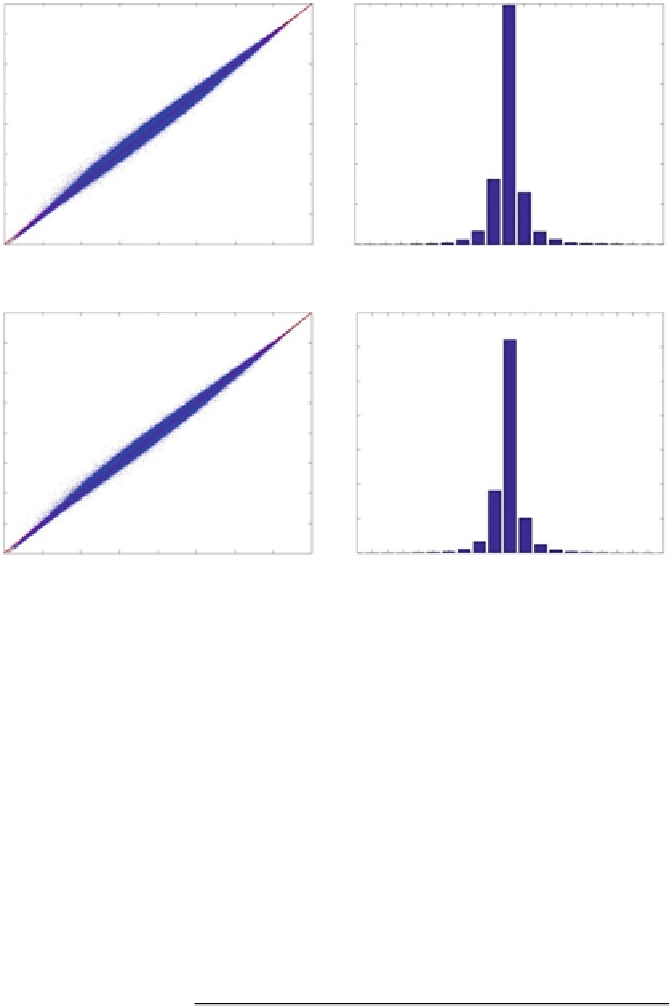
MODIS Band 31
MODIS Band 31
a
b
340
60
Bias=-0.0039K, Stdev= 0.6031K
Bias=-0.0039K, Stdev= 0.6031K
320
50
300
40
280
260
30
240
20
220
10
200
180
0
180
200
220
260
Aggregated MODIS BT(K)
240
280
300
320
340
-5 -4.5 -4 -3.5 -3 -2.5 -2 -1.5 -1 -0.5
BT Difference (K)
0 0.5 1 1.5 2 2.5 3 3.5 4 4.5 5
MODIS Band 32
MODIS Band 32
c
d
340
70
Bias=-0.0535K, Stdev= 0.5461K
Bias=-0.0535K, Stdev= 0.5461K
320
60
300
50
280
40
260
30
240
20
220
10
200
180
0
180
200
220
240
260
280
300
320
340
-5 -4.5 -4 -3.5 -3 -2.5 -2 -1.5 -1 -0.5
BT Difference (K)
0 0.5 1 1.5 2 2.5 3 3.5 4 4.5 5
Aggregated MODIS BT(K)
Fig. 5.5
Comparison of AIRS-simulated MODIS and aggregated MODIS at AIRS footprints.
(
a
) Brightness temperature of MODIS band 31; (
b
) histogram of band 31 brightness temperature
difference between AIRS-simulated MODIS and aggregated MODIS; (
c
) brightness temperature
of MODIS band 32; (
d
) histogram of band 32 brightness temperature difference between AIRS-
simulated MODIS and aggregated MODIS
Table 5.1
Difference of
brightness temperature
between simulated MODIS
and aggregated MODIS
Band
1 K (%)
0.5 K (%)
0.25 K (%)
<
<
<
Band 31
93.01
80.57
59.66
Band 32
94.12
82.51
62.15
Table 5.2
Relative
difference of brightness
temperature between
simulated MODIS and
aggregated MODIS
Band
1%
0.5%
0.2%
<
<
<
Band 31
99.15%
95.70%
81.57%
Band 32
99.36%
96.42%
83.18%


Search WWH ::

Custom Search