Environmental Engineering Reference
In-Depth Information
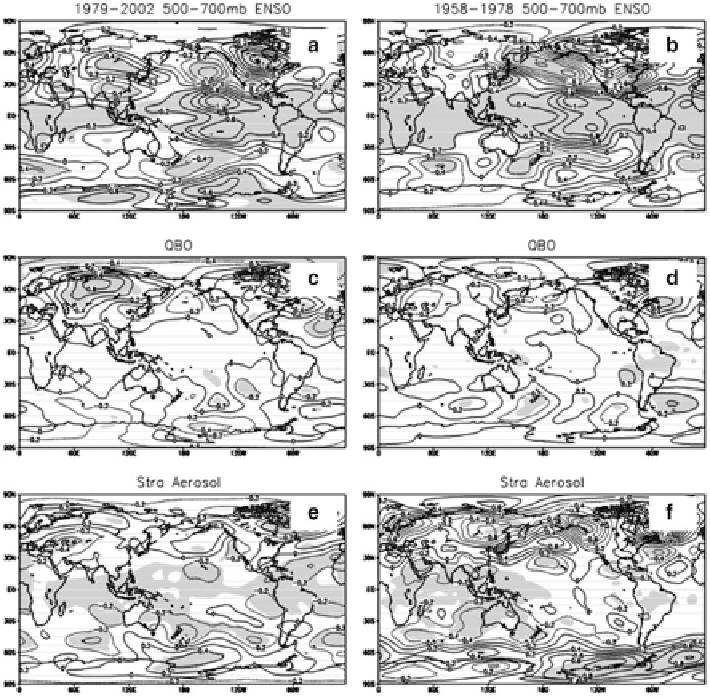
Fig. 4.6
Same as Fig.
4.5
except for the troposphere (500-700 hpa)
However, it is worth noting that the solar response in the regression analysis is
not statistically significant in the Arctic region. The different temperature trends in
the two periods can be reasonably explained jointly by solar, ENSO, QBO, and
stratospheric aerosols.
4.5 Summary
Based on the multiple linear regressions for a selected set of forcing parameters
computed from two reanalysis (NCAR/NCEP and ERA40) datasets and one satellite-
retrieved temperature (MSU) dataset, the temperature responses to climate forcings
in winter (December-February) are compared between the pre- (1958-1978) and post
(1979-2002) periods of satellite data assimilation. The results show:
Search WWH ::

Custom Search