Environmental Engineering Reference
In-Depth Information
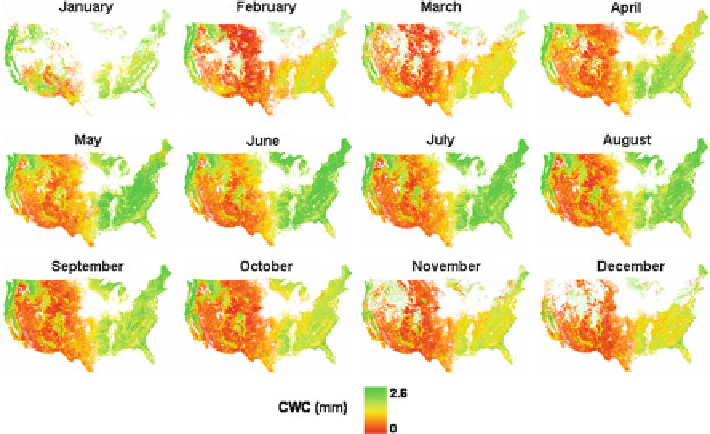
Fig. 20.6
Monthly changes in CWC during 2005 for natural vegetated areas in the USA. Each
month is depicted by a single image composite after areas covered by snow, clouds, water, and
agricultural land-cover types were masked out (Trombetti et al.
2008
)
MODIS, which were put in relation to rainfall and temperature patterns on each
eco-region (Fig.
20.6
).
20.10 Conclusions
While more research needs to be done to develop and validate inversion algorithms
for CWC, it must be realized that much more effort over a longer time period was
expended for environmental data records based on NDVI (Tucker et al.
2005
).
NDVI data collection began in 1982, so the data record can be used to distinguish
the contributions of local and global drivers for changing vegetation dynamics
(Neigh et al.
2008
). The availability of global imagery with shortwave-infrared
bands began in 1998 with SPOT Vegetation and AVHRR/3. These sensors have one
band in the shortwave infrared, so NDII could be used as a start for a CWC data
product. Given the relationships among NDII, CWC, and VWC, NDII could be
quickly assimilated into microwave data products for soil moisture.
On the other hand, MODIS and VIIRS have multiple bands at wavelengths at
which liquid water absorbs solar radiation, so CWC data products are not limited to
NDII or NDWI. Inversions of radiative transfer models have potentially the highest
accuracies for retrieval of most vegetation parameters, which are required for
applications detecting water stress and monitoring FMC (Ria˜o et al.
2005
).
CWC data products are nearing maturity in part by using the synergy between
Search WWH ::

Custom Search