Environmental Engineering Reference
In-Depth Information
a
b
50
°
N
40
°
N
30
°
N
c
d
50
°
N
40
°
N
30
°
N
120
°
W
110
°
W
100
°
W90
°
W80
°
W70
°
W
120
°
W
110
°
W
100
°
W90
°
W80
°
W70
°
W
4812
44
(mm)
44
(mm)
16
20
24
28
32
36
40
4
8
12
16
20
24
28
32
36
40
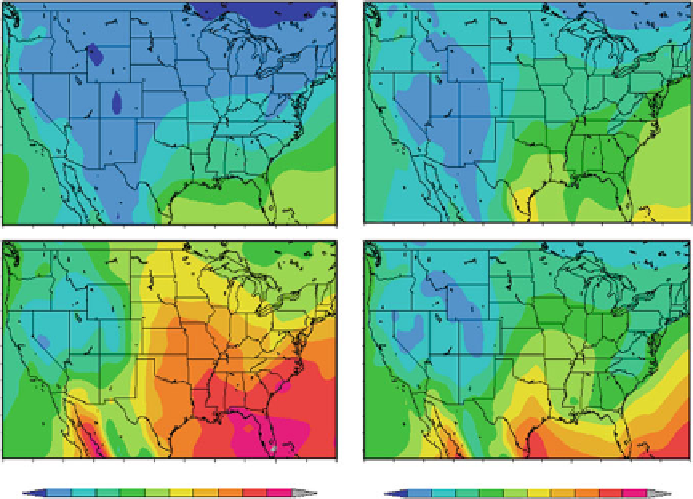
Fig. 19.17
Spatial distribution of water vapor amount during: (
a
) winter, (
b
) spring, (
c
) summer,
and (
d
) fall as available from the ETA model
Further analysis shows that the effects of water vapor radiative forcing may be
another important factor for the decrease in DTR in summer over the southeastern
United States (Sun et al. 2006). As shown in Fig.
19.17
, water vapor amount is
higher over the eastern USA than in the western part; it is highest over the
southeastern part during summer.
19.5.2 Comparison of Dual-Window and Split-Window
Algorithms
It is appropriate here to examine whether the LST retrieved from the dual-window
(3.9 + 11
m) algorithm is comparable to LST derived from the split-window
channels (viz., two far-infrared channels, 11 + 12
μ
m) that has never been com-
pared before, for ensuring the applicability of the dual-window algorithm in the
future. For each of the two algorithms, we calculated the bias, standard deviation
(STD), and root mean square (RMS) errors in the satellite LST retrieval as
evaluated against the in situ observations (Fig.
19.18
).
The scatter plots shown in Fig.
19.18
indicate that both algorithms perform well,
since they have fairly good correlation with the ground observations, though the
scatter distribution of the dual-window (3.9 + 11
μ
μ
m) algorithm is worse than the
split-window (11 + 12
μ
m) algorithm, bringing about the STD error of 2.53 K from
Search WWH ::

Custom Search