Environmental Engineering Reference
In-Depth Information
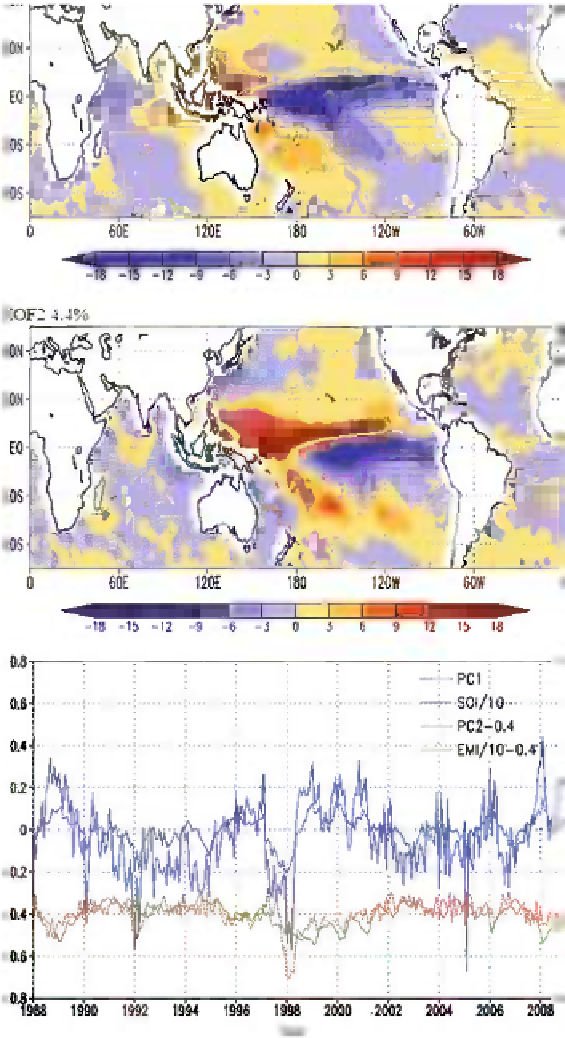
Fig. 15.10
First (
top panel
) and second (
middle panel
) EOF pattern of nonseasonal rainfall,
explaining 6.9 and 4.4% of the nonseasonal variance, respectively. The
lower panel
shows the
associated time series (PC1 and PC2). A scaled Southern Oscillation Index (
SOI
) is included for
comparison. The correlations between SOI and PC1 and PC2 are 0.8 (significant at the 95%) and
0.11 (not significant), respectively. PC2 leads variations in SOI (correlation at 0.4) by 6 months.
The correlation between PC2 and an index of the ENSO Modoki (or ENSO central Pacific) index is
0.55, significant at the 95%
Search WWH ::

Custom Search