Environmental Engineering Reference
In-Depth Information
60N
50N
40N
30N
20N
10N
EQ
10S
20S
30S
40S
50S
60S
0
60E
120E
180
120W
60W
0
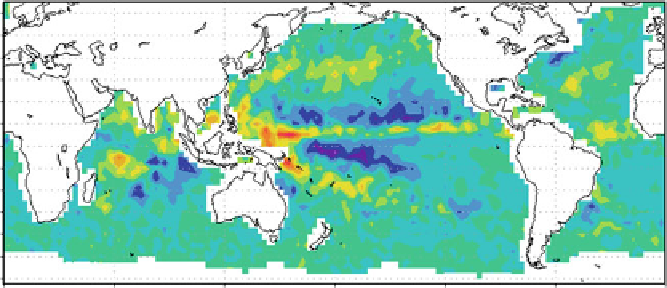
Fig. 15.9
Map of distribution of linear trends (mm day
1
decade
1
) of oceanic rain rates. The
linear trends are computed from linear regression analysis of the nonseasonal (with climatology
removed) data
ENSO as the eastern Pacific ENSO (EP ENSO) and central Pacific ENSO
(CP ENSO) (Yeh et al.
2011
). PC2 shows a significant correlation of 0.55 with an
ENSO Modoki index (EMI, available at:
http://www.jamstec.go.jp/frcgc/research/
15.4.3 TRMM Applications
A passive microwave imager was launched as part of TRMM instrument package.
The TRMM Microwave Imager (TMI) has similar channels as the SSM/I, with an
additional channel of 10 GHz. Early analysis of the METH rain rate demonstrated
that microwave rainfall estimates can produce climate signals such as the El Nino/
Southern Oscillation (Chang et al.
1993
; Kafatos et al.
2001
). The METH algorithm
has been applied to TMI data (Chang et al.
1999
; Kummerow et al.
2000
). The
strength of this product is its robustness and, when properly calibrated, is capable of
detecting climate-scale signals.
15.4.4 TRMM Boost
The robustness of this technique is demonstrated when the TRMM satellite is
boosted from an original altitude of 350 km to a higher altitude of 402 km in
August 2001 to save fuel and prolong satellite and mission life. The change in the
satellite altitude changes the TMI's earth's incidence angle and the atmospheric
paths and introduces discontinuities in the retrieved radar rainfall and reflectivity
(Shimizu et al.
2009
; Short and Nakamura
2010
). We perform a quick fix by
Search WWH ::

Custom Search