Environmental Engineering Reference
In-Depth Information
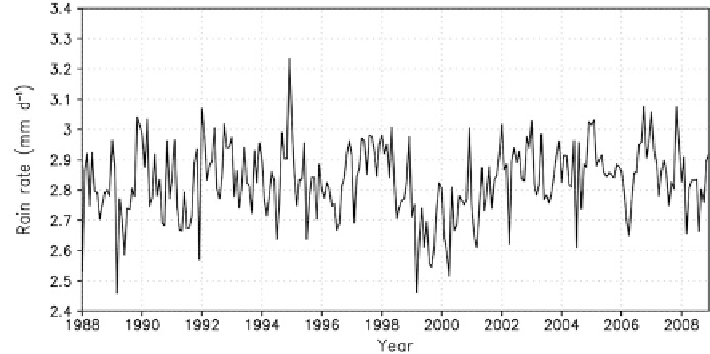
Fig. 15.4
Time series of the domain average rain rate.
Grid boxes
with insufficient samples are
excluded in the compilation
and April in the Pacific, while there is only a slight hint in the Atlantic, probably due
to the low product resolution (2.5
). It should be pointed out that during the warm
phase of El Nino years, the two rainbands merge to form a huge rainband, and the
double ITCZ disappears. The existence of a double ITCZ in the eastern Pacific has
been suggested to be related to the existence of a cold tongue (low sea surface
temperature), while the central and western portion is due to cold advection by the
easterlies (Zhang
2001
). While the existence of a double Atlantic ITCZ has been
demonstrated by surface wind convergence derived from scatterometer data (Liu
and Xie
2002
), detail structure and intensity of these features pose challenges to the
modeling community (Lin
2007
).
The storm tracks intensify during June and fully develop during July and August.
The rather wide band of rainfall in the western part of the north Pacific and north
Atlantic oceans indicate the variability of the typhoon (hurricane) tracks. The high
rain rates located off the western coast of India, in the Bay of Bengal, and off the
eastern coast of China coincide with the monsoon on set in June. The heavy rain in
the Bay of Bengal persists into August.
15.3.3.2 Conditional Rain Rate (
r
cond
)
The conditional rain rate (
r
cond
), or the rain rate in rainy conditions, is computed
using the formula r
cond
¼
2
) (see Eq.
15.4
) and shown in Fig.
15.6
. The
pattern of conditional rain rate follows that of total rainfall. The high conditional
rain rates around Antarctic may be due to the inclusion of pixels that contain sea ice
but was not detected in the algorithm.
μ
σ
exp (
+½
Search WWH ::

Custom Search