Environmental Engineering Reference
In-Depth Information
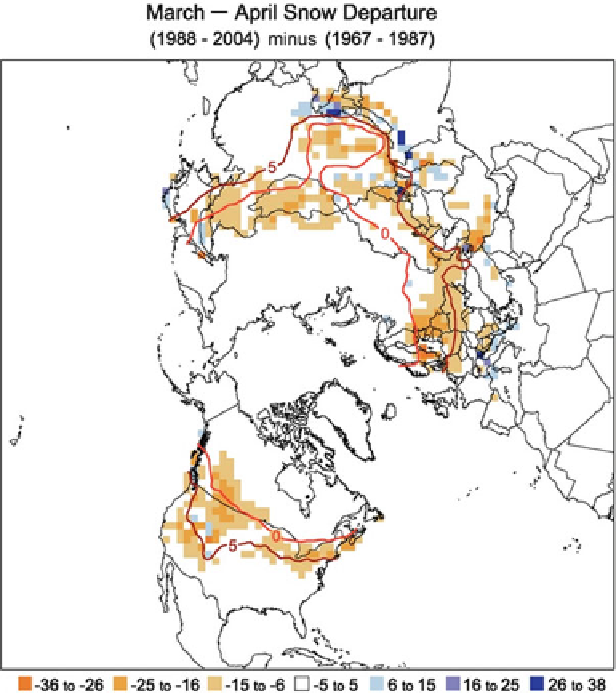
Fig. 14.2
Differences in the distribution of Northern Hemisphere March-April average snow
cover between earlier (1967-1987) and later (1988-2004) portions of the satellite era (expressed in
% coverage).
Negative values
indicate greater extent in the earlier portion of the record. Extents
are derived from NOAA/NESDIS snow maps.
Red curves
show the 0 and 5
C isotherms averaged
for March and April 1967-2004, from the Climatic Research Unit (CRU) gridded land surface
temperature version 2 (CRUTEM2v) data (From IPCC 2007)
(e.g., Grody and Basist
1996
). Snow cover products have been also generated
from the Advanced Microwave Sounding Unit (AMSU) onboard NOAA polar-
orbiting satellites (Kongoli et al.
2004
) and from the Advanced Microwave Sounding
Radiometer (AMSR-E) onboard the Aqua satellite (Kelly et al.
2003
). Most clouds are
transparent in the microwave which makes microwave snow remote sensing
techniques practically weather independent. Microwave-based techniques also attract
a lot of interest due to their ability (although rather limited) to provide information on
physical properties of the snow pack, particularly on its depth and water equivalent. To
identify snow in satellite imagery, most algorithms utilize observations of upwelling
microwave radiance at two frequencies, typically 19 and 37 GHz. Algorithms to infer
Search WWH ::

Custom Search