Environmental Engineering Reference
In-Depth Information
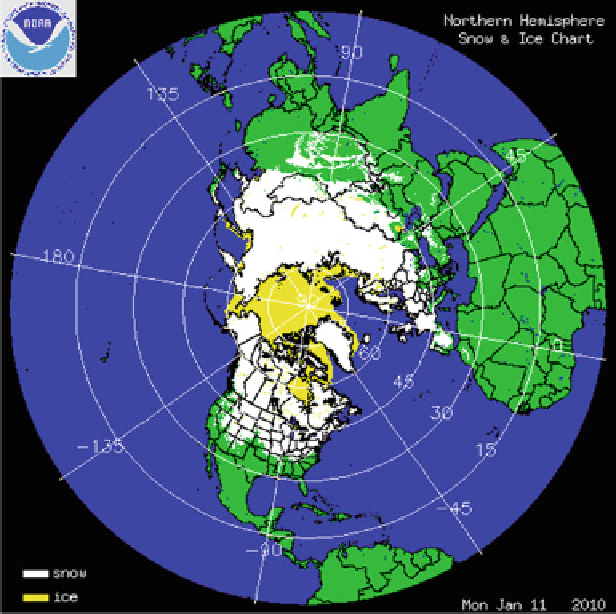
Fig. 14.1
Example of the daily snow and ice cover map for the Northern Hemisphere generated
within NOAA interactive multisensor snow and ice mapping system (IMS). On the web at
http://
extent recovered and remained close to its average values from late 1990s into the
beginning of the twenty-first century. Despite this recovery, the overall trend in the
satellite-derived snow extent since early 1970s remains negative. Figure
14.2
illustrates the differences in NH springtime snow cover for the period 1988-2004
relative to the period 1967-1987 derived from NOAA interactive snow cover
charts. While there are some areas where snow cover increased, overall the extent
of snow cover in spring has declined.
14.3 Snow Retrievals with Microwave Sensors Data
Since 1978 global observations of the snow cover have been performed using
microwave measurements from Nimbus-7 Scanning Multichannel Microwave
Radiometer (SMMR) and later, since 1987, with the Special Sensor Microwave
Imager(SSM/I)flownbytheDefenseMeteorological Satellite Program (DMSP)
Search WWH ::

Custom Search