Environmental Engineering Reference
In-Depth Information
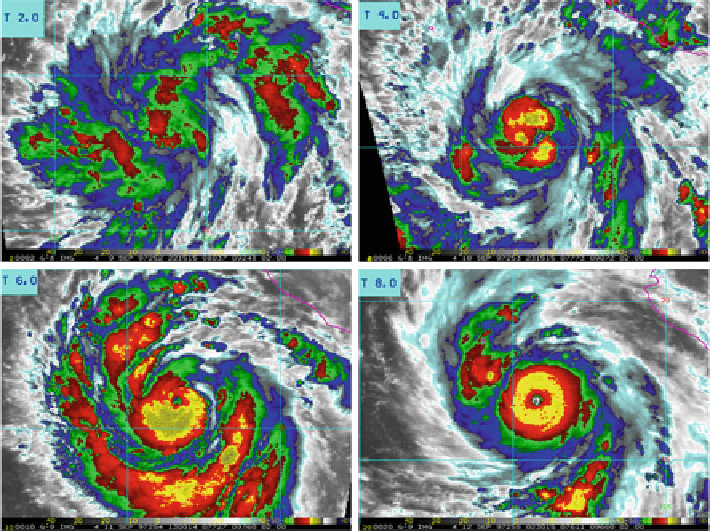
Fig. 10.2
Enhanced IR images of Hurricane Linda with Dvorak intensities T2, T4, T6, and T8.
Hurricane Linda was located in the eastern North Pacific, southwest of Mexico, during 9-17
September 1997
associated with the lowest pressure at the tropical cyclone center. The eye is
surrounded by a circular area which has the strongest winds within very deep
clouds and heavy rain, known as the eyewall. The Dvorak technique analyzes
visible features and IR temperatures of the eye and the surrounding deep clouds
to assign the intensity. In general, the Dvorak tropical cyclone intensity increases as
the eye gets warmer and better defined, and the surrounding clouds get colder and
more symmetric. A continuous very cold circular ring of cloud tops generated by
the eyewall along with a warm eye temperature indicates an intense tropical
cyclone. Enhanced IR images of Dvorak intensities T2, T4, T6, and T8 are shown
in Fig.
10.2
with Hurricane Linda that was located in the eastern North Pacific in
September 1997.
An analysis of errors associated with Dvorak intensity estimates in comparison
with the “best track” values is shown in Fig.
10.3
. The best track is determined by
the post-storm analysis of all available information, including aircraft intensity
estimates, and is considered ground truth. Figure
10.3
shows that the Dvorak
maximum wind estimates are normally accurate to within 5-10 kt but can some-
times be much larger. Knaff et al. (
2010
) performed a systematic analysis of the
errors and biases of the Dvorak intensities. The results show that some of these
biases are systematic and can be corrected, which would lead to further improve-
ment of the operational Dvorak method.
Search WWH ::

Custom Search