Environmental Engineering Reference
In-Depth Information
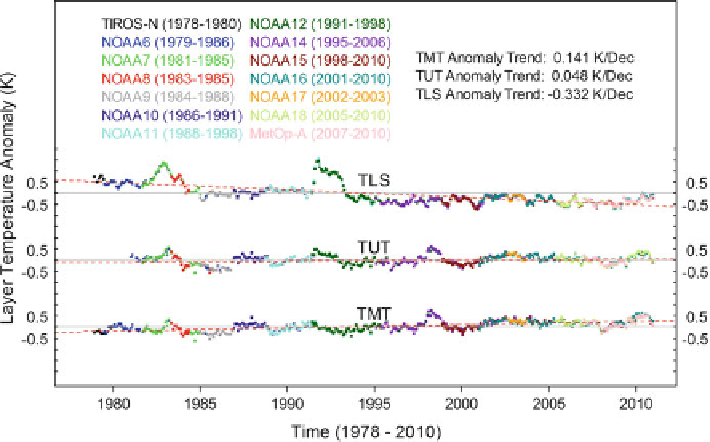
Fig. 8.9
Monthly global mean anomaly time series for temperature mid-troposphere (
TMT
),
temperature tropopause and stratosphere (
TTS
), and temperature lower stratosphere (
TLS
) for
different satellites after all calibrations and bias corrections are done. Merged time series are
obtained by averaging available satellite observations at any data point
known as TUT abbreviated for temperature upper troposphere), and temperature
lower stratosphere (TLS, MSU channel 4 merged with AMSU-A channel 9).
Figure
8.9
shows global mean pentad anomaly time series for these variables for
all satellites used in the dataset (TIROS-N through NOAA-18 and MetOp-A). In the
plot, different colors represent different satellites. As seen, different satellites agree
with each other on a point-by-point basis during overlapping observations,
indicating high quality of intercalibration and merging in the time series.
From these time series, an updated temperature trend for different atmospheric
layers is obtained. The global mean 32-year trend from 1979 to 2010 for the TMT
and TLS is respectively 0.141 K/decade and
0.332 K/decade, and the 30-year
(1981-2010) trend for TTS is 0.048 K/decade.
8.4 Conclusion and Data Availability
A climate-quality MSU/AMSU radiance FCDR and atmospheric temperature
TCDR have been developed at NOAA/NESDIS using SNO calibration methodol-
ogy. The FCDR consists of SNO-calibrated Level-1c radiances for different MSU
and AMSU channels. Instrument calibration errors related to inaccurate calibration
nonlinearity and solar heating-induced instrument temperature variability have
been minimized in the FCDR. The TCDR includes TMT, TTS, and TLS from
Search WWH ::

Custom Search