Environmental Engineering Reference
In-Depth Information
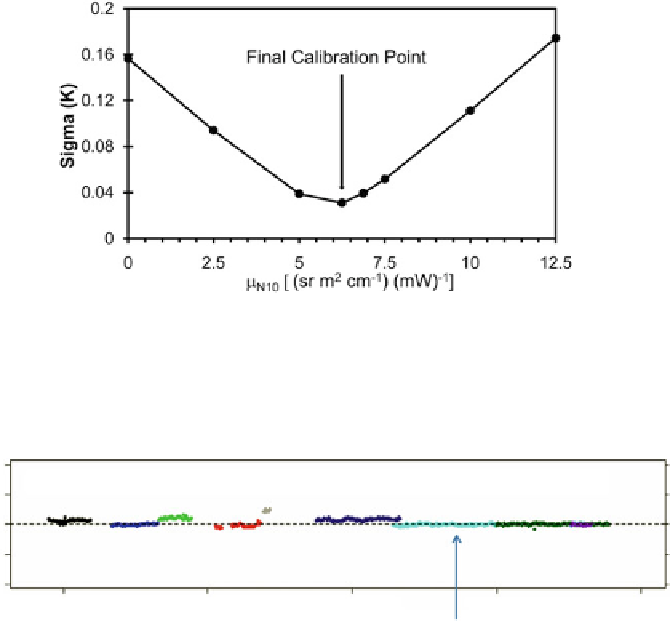
Fig. 8.5
Mean standard deviation (
σ
m
) of the inter-satellite different time series for all satellite
pairs versus
μ
N10
in the sensitivity experiments for MSU channel 2. See Fig.
8.3
for a schematic
viewing of
σ
for a particular satellite pair. The
μ
N10
value corresponding to the minimum of
σ
m
is
selected as the final calibration point
N6-NTN
N7-N6
N8-N7
N9-N6
N10-N9
N11-N10
N12-N11
N14-N12
N14-N11
1980
1985
1990
Inter-satellite differences significantly reduced
compared to NOAA operational calibration
show in Figure 8.3
1995
2000
Fig. 8.6
Similar to Fig.
8.3
but for SNO-calibrated MSU Level-1c data, where calibration
coefficients were obtained sequentially from SNO matchups with the requirement of minimizing
global ocean-mean inter-satellite
T
b
differences (
σ
m
) for all satellite pairs
calibration are about 0.05 and 0.03 K, respectively, compared to 0.5 and 0.1 K in the
NOAA operational calibration in Fig.
8.3
.
8.2.4 Data Assimilation of Radiance FCDR in Climate
Reanalysis
The SNO-calibrated FCDR is expected to have good impact on the climate re-
analysis development since the instrument calibration errors have been minimized.
As an effort to test the performance of the inter-satellite calibration for climate
reanalysis improvement, 20 years (1987-2006) of SNO-calibrated MSU Level-1c
radiances for channels 2, 3, and 4 onboard NOAA-10 through NOAA-14 were
assimilated into the new generation of NCEP Climate Forecast System Reanalysis
Search WWH ::

Custom Search