Environmental Engineering Reference
In-Depth Information
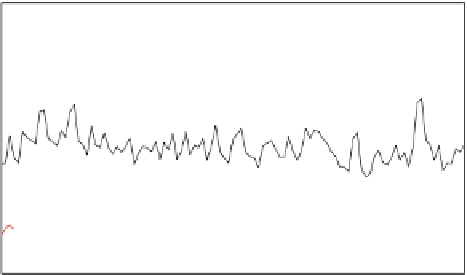
Fig. 7.3
Global spatial standard deviation of the indicated analyses
is done. The adjustment is done monthly, with the annual adjustment linearly
interpolated to the month.
An indication of interannual variations associated with climate modes is given
by correlations against the Southern Oscillation Index (SOI, Trenberth
1984
) and
the NAO index (Hurrell
1995
). For the SOI, annual-average values are used, while
for the NAO December to March averages are used (Fig.
7.4
). As expected, the SOI
correlation is strongest in the tropics, with extensions into the extra tropics into
areas influenced by the SOI. The NAO correlations are strongest in the Northern
Hemisphere, and its known influence on Europe and North America is reflected
(Hurrell et al.
2003
). For both the oceanic analysis shows extensions of the
influence from land to adjacent oceanic regions. Thus, a more complete description
of the influence of the climate modes over the twentieth century is available using
the reconstruction.
Trends in the merged reconstruction (Fig.
7.5
) indicate that the tropical oceans
account for most of the global trend. Land trends are much weaker than the oceanic
trends, and they also tend to be out of phase. The out-of-phase relationship may
reflect shifts of precipitation from land to ocean areas over the twentieth century.
A similar out-of-phase land-sea relationship was noted for ENSO events (Adler
et al.
2008
). These results suggest that the multi-decadal relationships may share
features with the ENSO relationships.
7.6 Conclusions
This chapter shows that it is possible to reconstruct large-scale features of oceanic
precipitation variations beginning 1900. Reconstructions require accurate base data
such as analyses using satellite-based observations. The base data are needed to
form statistics that can be used with the limited historical data to reconstruct


Search WWH ::

Custom Search