HTML and CSS Reference
In-Depth Information
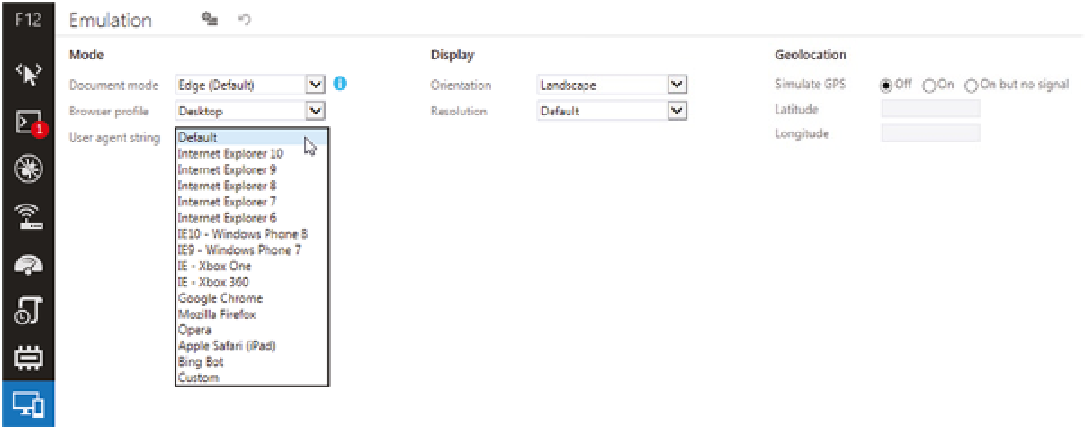
Figure 11-8.
Emulation in Internet Explorer
In Firefox, you can launch the Inspector by pressing F12 or right-clicking any element of a web site and selecting
Inspect Element (Q) from the local menu. The Inspector is a very useful tool, allowing web designers to analyze not
only the DOM tree but also the style sheets applied to an element, including the rulesets declared explicitly and the
ones inherited from parent elements (Figure
11-9
). Those styles that are not applied are crossed out, making it easy
to identify more specific styles. The CSS styles can be disabled and re-enabled by clicking on the checkbox in front
of them. Any of the CSS styles can also be overwritten on the temporary files used to render the page, providing the
option to check a different background color, font size, etc. without actually modifying any physical files.
Figure 11-9.
Firefox Inspector
Safari's Developer Tools are available from Edit
➤
Preferences
➤
Advanced
➤
Show Develop Menu in menu bar [41],
or by right-clicking an element of a web page and selecting Inspect element. Opera also offers a similar feature
under Page
➤
Developer Tools [42] and by right-clicking an element and selecting Inspect Element. The Developer
Tools of Google Chrome can show the DOM tree, the applied CSS rulesets, including the computed property values,
and Event listeners (available under More tools
➤
Developer Tools or by pressing Ctrl + Shift + I).

Search WWH ::

Custom Search