Environmental Engineering Reference
In-Depth Information
Table 3.7 Examples of estimated average cost functions for BC small systems in 2008 CDN
dollars for three capacity levels
Water treatment classi
cation
Average cost function
Predicted cost per cubic meter
based on plant with daily
capacity
100 m
3
200 m
3
500 m
3
y = 19.343x
−
0.6428
Class 1
1.00
0.64
0.36
y = 25.537x
−
0.5998
Class 2
1.61
1.06
0.61
y = 375.873x
−
1.000
Class 4
3.76
1.88
0.75
Details of the NLLS estimation are shown in Appendix
C
. Costs shown above
for Class 1 are operating costs for treatment only. Class 1 plants with a daily
ow
rate of 100 m
3
can produce drinking water at an average cost of $1.00, while the
cost is almost quadrupled for a similar sized plant producing Class 4 drinking water
on an island off the coast of British Columbia.
3.7 Summing up and Tentative Conclusions
We can now show, in Figs.
3.3
and
3.4
, that with the estimated cost functions, we
can reproduce an actual set of cost functions that can then be compared to the
hypothetical Fig.
3.1
. Figure
3.3
shows the estimated cost curves based on man-
ufacturers
rated costs, while Fig.
3.4
shows the estimated cost curves based on a
sample of small systems in BC.
Figure
3.3
indicates that ozone technology, a Class 4 water treatment, is more
expensive than the Class 3 (UV and MF-UF) and Class 2 (HRC) treatment types.
'
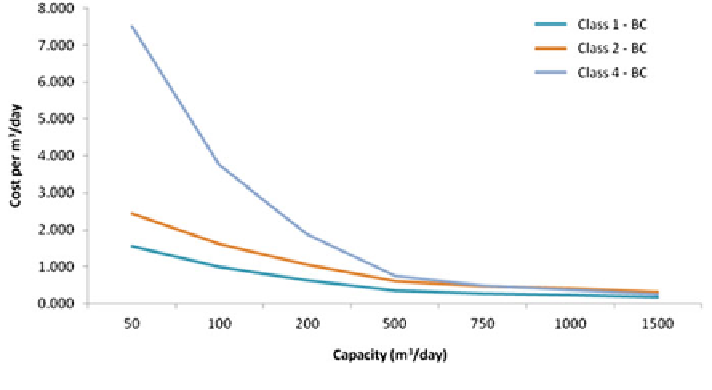
Fig. 3.4 Estimated cost curves: Classes 1, 2 and 4 for BC Small Systems


Search WWH ::

Custom Search