Environmental Engineering Reference
In-Depth Information
maintenance and renewal of infrastructure. In Italy, France, as well as England and
Wales, water losses amount to 28, 26, and 19 percent, respectively (see Fig.
12.2
).
On average, the rates of damages to water supply lines are less than10 damages
per 100 km per year. Moreover, the total investment in drinking water supply
amounts to more than 2 billion euros per year. The investments are
nanced
through higher prices and charges that also cover facility maintenance. Due to a
stable population, there appears to be no need for an extension of the water net-
work. Furthermore, Germany has the highest average investments in the drinking
water sector. In the period from 1995 to 2003, Germany invested 0.54 euros per
cubic meter, while England and Wales invested 0.53 euros per cubic meter, France
0.33 euros per cubic meter and Italy 0.15 euros per cubic meter in the same period
(VEWA-Studie
2006
, as cited in Althoff (
2007
).
12.3 Water Consumption in Germany
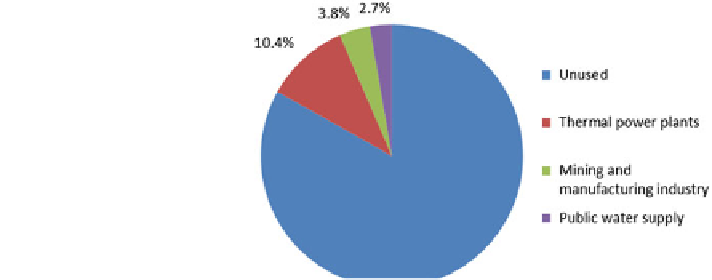
Germany is a water-rich country. In 2007, the total renewable water reserve
amounted to 188 billion cubic meters. Only 17 percent of total annual water reserve
(or 31.8 cubic meters) was actually used, of which 10 percent (or 15.6 cubic meters)
went to thermal power plants for public supply, 3.8 percent (or 7.1 cubic meters) to
the mining and manufacturing industries for industrial purposes, 2.7 percent (or 5.1
cubic meters) for water utilities to provide drinking water to households and small
business enterprises (see Fig.
12.3
). Moreover, in Germany water abstraction for
agriculture plays a minor role, with less than 1 percent of the total available water
resources, thanks to climatic and geographic conditions, while the other EU
countries have a much higher water consumption for agriculture.
As shown in Fig.
12.4
, over the past two decades, drinking water consumption
has fallen by 17 percent to 122 liters per capita per day in 2009. The drop was
primarily due to (a) conservation and water pricing policies that include incentives
for ef
cient use of water resources, (b) the linking of the price to the amount of water
Fig. 12.3 Available water
resources and water use in
Germany (2007) (Reproduced
from ATT et al. 2011)
Search WWH ::

Custom Search