Environmental Engineering Reference
In-Depth Information
Samples >10
µ
g due to pH and stagnation adjustments (stag based
Ottawa Spring data)
300
253
250
201
200
150
100
52
50
0
No of samples >10
µ
g /L before adjustments
No of samples >10
g /L due to adjustments
Total samples above 10
µ
µ
g/L
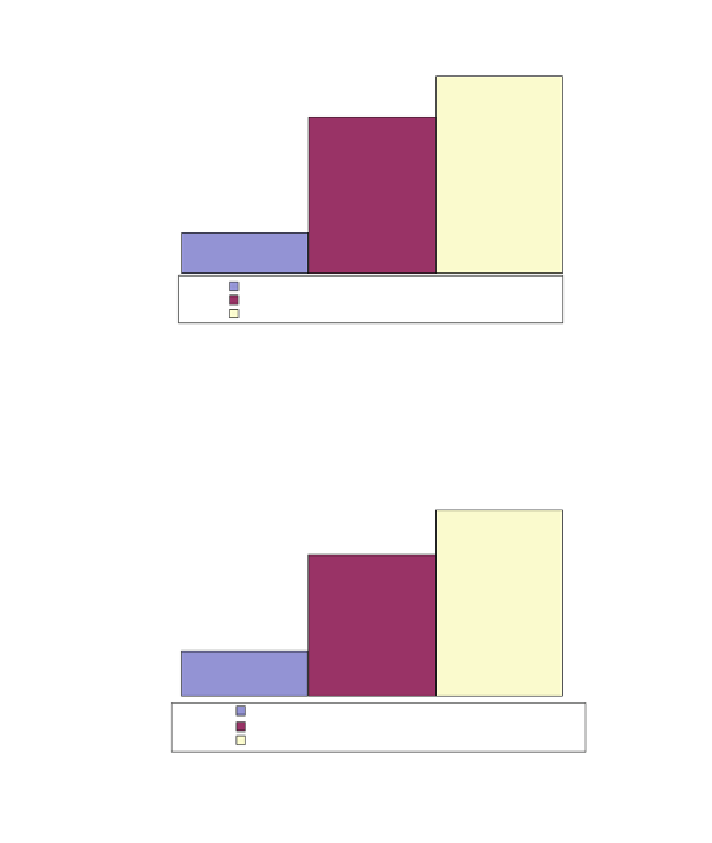
Fig. 11.11 Number of samples greater than 10
μ
g/L after pH and stagnation adjustment for
Ontario
Samples >10
µ
g due to pH and stagnation adjustments (stag based
Ottawa Summer data)
250
214
200
162
150
100
52
50
0
No of samples >10
µ
g /L before adjustments
No of samples >10
µ
g /L due to adjustments
Total samples above 10
µ
g/L
Fig. 11.12 Number of samples greater than 10
μ
g/L after pH and stagnation adjustment for
Ontario. Note pH in Ottawa ranges from 8.6 to 9.5; pH for the rest of Ontario ranges from 6.4 to
8.4
data only.
3
We have more con
dence in the estimated lead values when the per-
centage increase in lead between the 30 min and 6 h stagnation is based on Ottawa
summer data only since the temperature values for Ottawa summer are closer to that
observed in the Ontario data.
Figure
11.12
shows all samples from the Ottawa data under 30-min stagnation
protocol versus 6-h stagnation protocol.
3
See Sect.
2.1
for explanation on temperature differences and the
first liter sampling.


Search WWH ::

Custom Search