Environmental Engineering Reference
In-Depth Information
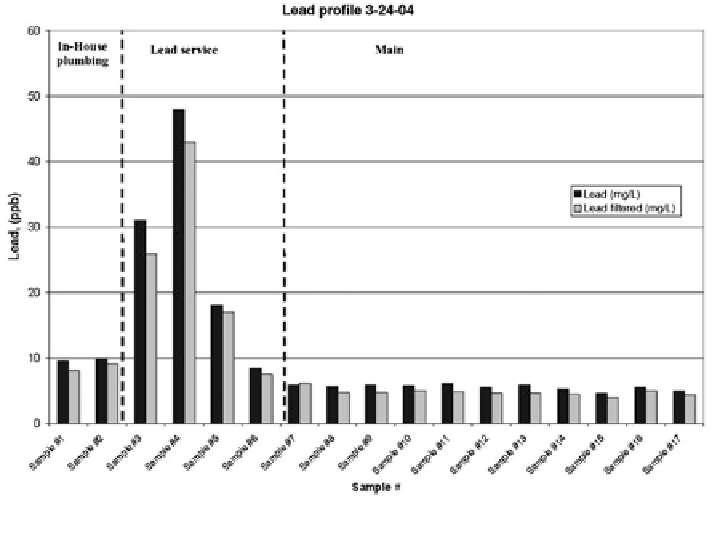
Fig. 10.2 Lead concentration by volume of water drawn in a house in Washington DC (Guidotti
et al.
2008
)
30 percent of lead leaching can be found in the
first 10 min sample. Lytle and
Schock (
2000
) showed that lead leaching accelerates in the
first 10 h of stagnation
and that up to 70 percent of maximum lead levels can be reached within that time
period while leaching can continue to occur even after 90 h of stagnation. The mass
transfer model of Kuch and Wagner (
1983
) indicated equilibrium stagnation time of
up to 6 h or more. Lytle and Schock (
2000
) have advocated obtaining stagnation
pro
les to predict human exposure and to assess corrosion control treatment. Indeed
stagnation pro
le of the
lead concentration by volume of water drawn from a house in Washington DC after
overnight stagnation is shown in Fig.
10.2
. A similar lead concentration pro
les can also show peak lead exposure conditions. A pro
le was
found in a case study for Ottawa (see Fig.
10.3
); in the case of the Ottawa samples,
both 30 min stagnation and 6 h stagnation pro
les are shown.
Figures
10.2
and
10.3
show that lead levels increase sharply when water reaches
the tap from the lead service line but decline rapidly once water arrives from the
main line section (Guidotti et al.
2008
, Campbell and Douglas
2008
). Both
Figs.
10.2
and
10.3
show that peak lead concentration was drawn at the fourth liter
of water while Maximum Allowable Concentration Levels (MAC) were exceeded
at the 4th and 5th liters for Ottawa under the 6 h stagnation protocol. Hence, the
volume of water drawn in relation to its lead concentration pro
le can determine
lead exposure. Campbell and Douglas (
2008
) showed that lead in drinking water
can be minimized via pH and corrosion control, as well as having a proper
Search WWH ::

Custom Search