Environmental Engineering Reference
In-Depth Information
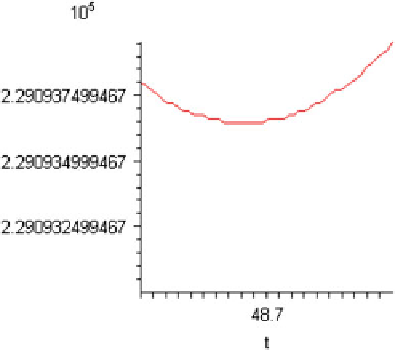
Fig. 8.4 Iterative adjustment reveals that the precise solution is 48.7 years
Failure Cost
3000
2500
2000
1500
Failure Cost
1000
500
0
40
41
42
43
44
45
46
47
48
49
50
Cost
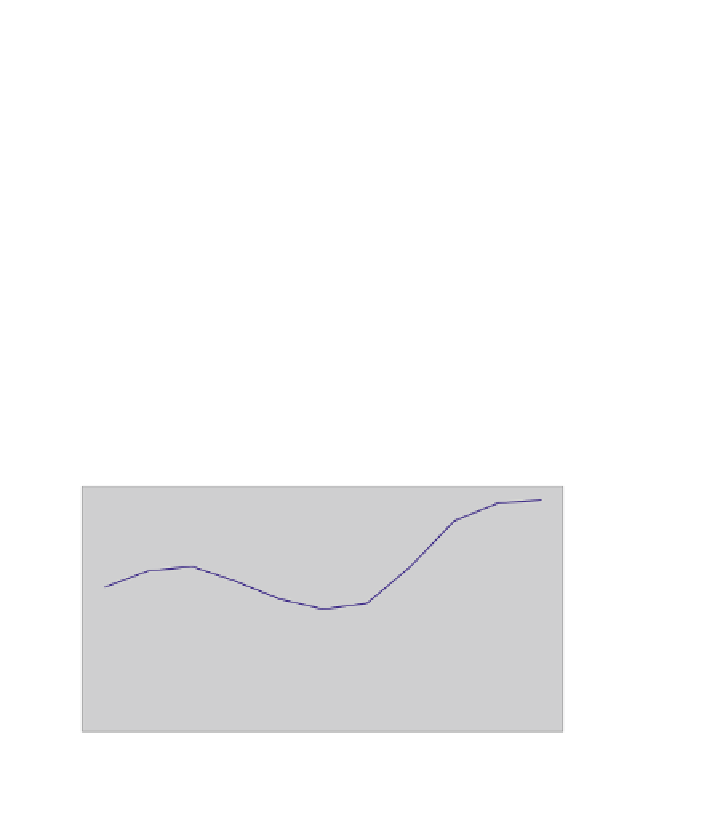
Fig. 8.5 S(x) in City A is nonlinear
the asset is new, and so this value is set to 10. The growth rate is adjusted so that the
logistic curve
fits the diagram above as closely as possible and this value is found to
be 0.15. This results in Eq.
8.11
:
35000e
0
:
15x
3500
þ
10 e
0
:
15x
S
ðÞ¼
ð
8
:
11
Þ
ð
1
Þ
This function is depicted in Fig.
8.7
.
The frequency of failure seems to have a carrying capacity of 4.5 and the initial
value should be very small
—
it is set to 0.0001. Again, the growth rate is adjusted so


Search WWH ::

Custom Search