Environmental Engineering Reference
In-Depth Information
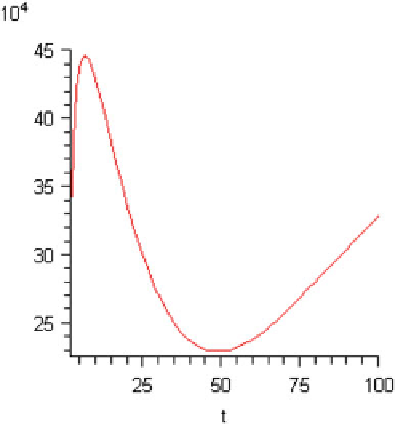
Fig. 8.3 The service cost of
this asset is minimized if it is
renewed approximately every
45
-
55 years
Substituting Eqs.
8.8
and
8.9
, the investment cost and the discount rate, into
Eq.
8.10
and assuming the average depth of 3.85 for all pipes in the network yields
Eq.
8.3
, which is depicted in Fig.
8.3
:
t
1
1
3769
:
487
þ
126
:
19x
R
Þ
e
0
:
0423x
dx
þ
41278
:
46e
0
:
0423t
ð
Þ
7
:
5947
þ
0
:
25789x
ð
C
ðÞ¼
1
e
0
:
0423 t
þ
1
ð
Þ
ð
8
:
10
Þ
Iterative scaling of this plot yields a minimum at approximately 48.7 years,
which is consistent with the solution obtained via continuous optimization of
48.691, as shown in Fig.
8.4
.
8.4.2.4 Nonlinearity
The nonparametric regressions of the functions S(x) and F(x) con
rm that these
functions are nonlinear as demonstrated in Figs.
8.5
and
8.6
.
Figure
8.5
shows that S(x) increases at a decreasing rate; Figure
8.6
shows that F
(x) is also increasing, at
first at an increasing rate, then at a decreasing rate. Logistic
curves will be used to approximate the curves in these diagrams. The rationale
behind using logistic curves is that failure and cost of failure in the
first few years is
not expected to be very high. However, after a few years these amounts begin to
grow. Yet, as the diagrams above show, there is a limit to this growth.
For the function S(x), the curve seems to be approaching its carrying capacity,
and so this value is set to 3,500. We do not expect very high costs of failure when

Search WWH ::

Custom Search