Environmental Engineering Reference
In-Depth Information
Table 5.7 Water pricing structure for residential and nonresidential consumers (Beecher and
Kalmbach
2013
)
Basic rate structures
Residential
percent
Nonresidential
percent
Decreasing-block
35
44
48
60
Uniform
30
38
25
31
Increasing-block
14
18
5
6
Combined-block
1
1
2
3
Total
80
100
80
100
Table 5.8 Conservation and assistance policies (Beecher and Kalmbach
2013
)
Number of systems
percent
Conservation information/tips
57
71
Payment assistance
21
26
Low-income discount
9
11
Senior discount
8
10
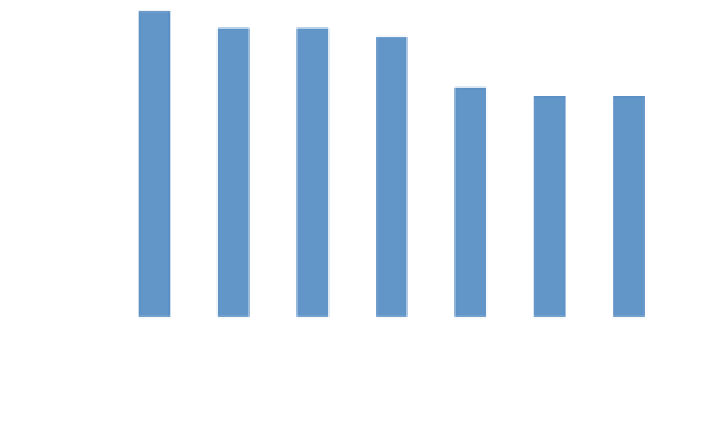
18
16
14
12
10
8
6
4
2
0
0 CF
500 CF
1k CF
3k CF
50k CF
1,000k
CF
2,000k
CF
Fig. 5.6 Fixed charges vary by the quantity of water usage in cubic feet (CF) (Reproduced from
Beecher and Kalmbach
2013
)
(f) Finally, Beecher and Kalmbach pointed out
pressure on water prices is due to
the movement toward cost-based and more ef
“
cient prices, exacerbated by
historical underpricing by some nonprivate systems, loss of subsidies and
transfers, and
flat or declining demand.
”
The overall picture shows that for the US as a whole, water is typically publicly
provided by a local municipality. All water systems have prices that cover full capital
and operating costs. About 20 percent of the utilities in the Great Lakes Basin sample


Search WWH ::

Custom Search