Environmental Engineering Reference
In-Depth Information
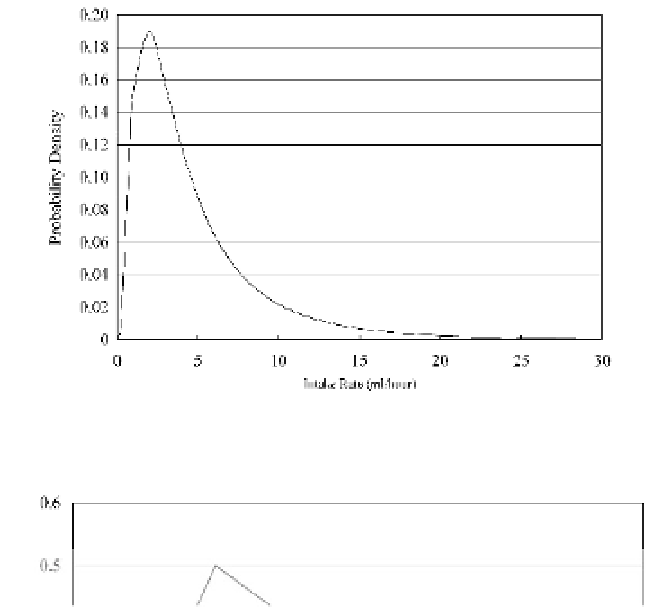
Fig. 9.22
Incidental ingestion rate distribution (lognormal with a mean of 5 and a standard deviation of 5) for canoeists
on the Chicago Waterway System (after Geosyntec, 2008)
Fig. 9.23
Exposure duration for canoeists in the Chicago Waterway System [Mean = 2.67 hours] (after Geosyntec, 2008)
dose-response models must account for two conditional probabilities: the probability that an organism is
ingested and the probability that once ingested an organism survives to infect the host (Haas et al., 1999).
Dose-response models assume that even a single organism has a finite probability of initiating infection
with an increasing number of pathogens resulting in an increasing probability.
The dose-response models normally take one of two forms: the Exponential Model and the Beta-Poisson
Model. The Exponential Model assumes that all of the ingested organisms have the same probability of
causing an infection. The Beta-Poisson Model is the current state-of-the-science for characterizing
dose-response relationships where the probability of host-pathogen survival is governed by a probability
distribution (Haas et al., 1999). Dose-Response Models Available for Poliovirus I, Echovirus 12, Coxsackie
Virus, Rotavirus,
Cryptosporidium
,
Giardia
,
Salmonella
,
Shigella
, among others.
Risk characterization
—The risk characterization normally is done probabilistically wherein probability
distributions of the various model inputs (such as Figs. 9.22 and 9.23) are used, rather than point estimates,


Search WWH ::

Custom Search