Environmental Engineering Reference
In-Depth Information
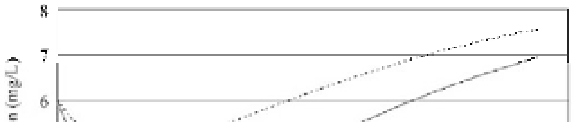
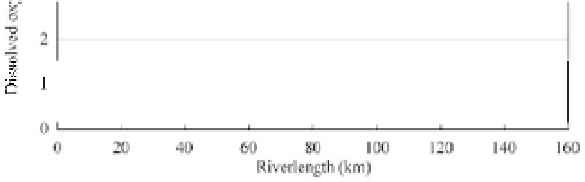
Fig. 9.2
Dissolved oxygen-sag curves for initial and allowable carbonaceous biochemical oxygen demand loadings
for the Streeter-Phelps example problem
demand at longer times (Davis and Masten, 2004, p. 280). When measuring CBOD, chemicals are added
to the sample to inhibit the nitrification process. Many water-quality models require information on the
ultimate CBOD (CBOD
U
), which may be computed from the CBOD
5
by reworking Eq. (9.2) as follows:
d
K
(9.3)
where both CBOD
5
and CBOD
U
are in milligrams per liter. James (1993, pp. 123-126) shows that estimates
of CBOD
U
and
K
d
derived from CBOD measurements over just 5 days may yield very poor results. He
presented an example for which 59 measurements of CBOD were made over a 20 day period. The best
nonlinear fit to these data yielded CBOD
U
= 10,100 mg/L and
K
d
= 0.217 d
-1
. However, if just the 30
measurements from the first 5 days were used, CBOD
U
-
K
d
pairs of 15,000 mg/L and 0.13 d
-1
and 8,000 mg/L
and 0.30 d
-1
yielded nearly equal results as for the best fit to the full 20 days of data. Thus, James (1993,
p. 123) recommended that some CBOD measurements at 15-20 days are needed to properly define CBOD
U
and
K
d
. Following this recommendation in the modeling of Salt Creek in the western suburbs of Chicago,
U.S., CBOD was measured over a 21-day period and a linear regression was fit between time and the
logarithms of oxygen demand to estimate CBOD
U
and
K
d
(Melching and Chang, 1996).
A related parameter to BOD is chemical oxygen demand (COD), which is the amount of oxygen needed
to chemically oxidize wastes. The COD test is much quicker and less expensive than a BOD test, taking
only a matter of hours. In a COD test, a strong chemical oxidizing agent is used to oxidize the organics
rather than relying on microorganisms to do the job. Thus, because of its ease and cost many agencies
measure COD rather than BOD. However, it does not distinguish between oxygen demand that will actually
be felt in the environment due to biodegradation, and the chemical oxidation of inert matter (Masters, 1991,
p. 126). Thus, the measured value of COD is higher than BOD, though Masters (1991, p. 126) speculates
that for easily biodegradable matter the two will be quite similar. However, in the modeling of water quality
in the Zenne River in Brussels, Belgium, Demuynck and Bauwens (1996) divided the COD concentrations
measured in the combined sewer system of Brussels by Wollast et al. (1992) by 2.5 to compute the CBOD
loads to the river. In general, the relation between COD and CBOD varies by location and type of water
(sanitary sewage, treatment plant effluent, in-stream flow, etc.). Thus, if COD data are to be used as a
surrogate for CBOD data in water quality modeling or analysis, some local CBOD data are necessary to
properly convert COD to an equivalent value of CBOD for the given location and type of water.
5
CBOD
CBOD / (1
e
)
U
5


Search WWH ::

Custom Search