Environmental Engineering Reference
In-Depth Information
volume balance, and this flow pushes any floating material towards point
B
. The presence of such material
is the most reliable signal that a density flow has formed. The concentration profiles change during the
process due to the mixing of clear water at the interface and deposition of a part of the coarse sediment.
Data from both flume experiments and field observations show that the critical condition for the formation
of a density current is (Fan, 1959):
2
q
0.6
(7.4)
'
U
U
3
0
gh
c
in which
q
is the discharge per unit width and
h
0
is the depth at the immersion point. From the equation,
if the water level upstream of the dam remains constant, an increase of the inflow discharge would cause
the immersion point to move downstream; and an increase in the density difference between the inflow
and the reservoir water would cause the point to move upstream.
The Xiaolangdi Reservoir is located 125 km downstream of the Sanmenxia Dam and about 860 km
upstream of the river mouth. The reservoir is the most downstream gorge-type reservoir on the Yellow
River. The multi-purpose reservoir is mainly for flood control, power generation and sediment retention
for reducing siltation in the lower Yellow River. The total capacity of the reservoir is 12.65 billion m
3
, of
which more than 7.55 billion m
3
will be used for trapping sediment. The reservoir began to impound in
October 1999. While the reservoir operates it traps coarse sediment and discharges fine sediment to the
lower reaches. In the first 8 years, coarse sediment was trapped as clear water and a portion of fine
sediment was released to the lower reaches mainly in the form of turbidity currents. Because a fraction of
coarse sediment is trapped by the reservoir, the rate of sedimentation of the lower Yellow River channel
is greatly reduced. Sediment finer than 0.02 mm was released to the lower reaches but it is mostly wash
load and does not cause siltation of the lower reaches.
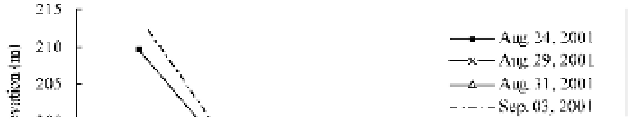
Since impoundment turbidity currents occurred every year, especially during hyper-concentrated floods,
the turbidity currents flowed to the dam and were discharged out of the reservoir when the bottom outlets
were open. Figure 7.21 shows the elevation of the interface between the turbidity currents and the upper
clear water layer for five turbidity currents in 2001 (Hou and Jiao, 2003). The interface remained in a
narrow range between 188 and 194 m in most parts of the reservoir, although the discharge of the turbidity
currents varied in the range of 200 m
3
/s-2800 m
3
/s, the sediment concentration varied between 13 kg/m
3
and 530 kg/m
3
, and the average velocity varied between 0.2 m/s to 1.2 m/s. The Froude number at the
plunging point was measured at 0.5-0.61, which approximates the situation represented by Eq. (7.4)
(Hou and Jiao, 2003).
Fig. 7.21
Elevation of the interface between the turbidity currents and the upper clear water layer (data are from
Hou and Jiao, 2003)


Search WWH ::

Custom Search