Environmental Engineering Reference
In-Depth Information
called the stage hydrograph, it can often be translated into flow rate (discharge) units. A stage recorder
can be as simple as a ruler along a bridge or other structures. It can be read periodically but it usually is
automatically recorded. The automation is achieved by using a water float, pressure sensor, or change in
electric resistance caused by water contact (Wanielista, 1990).
Discharge (or flow rate) is calculated by measuring the flow velocity. Current meters are revolution
counting meters that convert angular velocity to linear velocity and consist of a propeller or cup wheel, a
revolution counter, shaft, and ruder. If the depth of the flow is over 0.6 m, the U.S. Geological Survey
recommends that the average velocity for the section can be estimated as the average of the velocities
measured at 0.2 and 0.8 times the total depth of the watercourse. If the depth is less than 0.6 m, the U.S.
Geological Survey recommends that the velocity at 0.6 times the depth of the watercourse can be presumed
to represent the average velocity for that section of the stream. Once the average velocity for a section is
determined, the flow rate can be determined by multiplying the average velocity and the cross-sectional
area (Rantz et al., 1982).
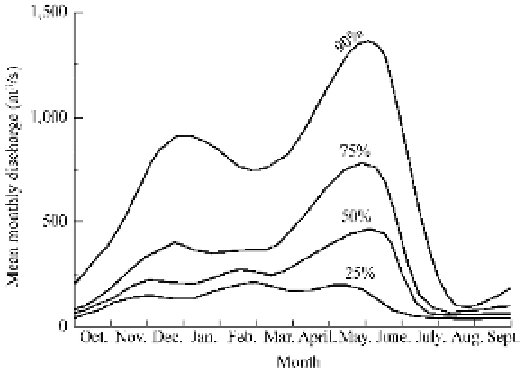
Fig. 5.1
An example of monthly probability curves. The curves indicate the probability that the mean monthly
discharge will be smaller than the value indicated by the curve
For a stable channel section, the discharge exhibits a good relation with stage in a form of curves,
which is called a stage-discharge relationship. Figure 5.2 shows the stage-discharge relation curve for the
Longchuan Hydrological Station on the East River in south China. With the curve the fluctuating discharge
during a flood can be estimated by recording stage variation. If sedimentation or erosion occurs in the
section and neighboring reaches the stage-discharge relation can change and the discharge should be
measured with current meters.
Fig. 5.2
Stage-discharge relation curve based on 20 years data for the Longchuan Hydrological Station on the East
River in south China


Search WWH ::

Custom Search