Environmental Engineering Reference
In-Depth Information
Therefore, two-phase debris flow exhibits extremely high resistance compared with normal sediment-laden
flow. The resistance of debris flow increases with the diameter of the solid material because collisions
among bigger particles consumes more energy and creates higher flow resistance.
4.3.3
Phenomena and Mechanisms of Pseudo-one-Phase Debris Flows
4.3.3.1
Development of Pseudo-one-Phase Debris Flows
Pseudo-one-phase debris flow often occurs in the Xiaojiang watershed on the Yunnan-Guizhou Plateau.
The solid materials are fine and consist of clay, sand, and gravel. The Dongchuan Debris Flow Observation
and Research Station further classifies the pseudo-one-phase debris flows into viscous debris flow if the
density of the mixture is higher than 1.9 g/cm
3
(generally between 1.9-2.3 g/cm
3
), subviscous debris flow if
the density is between 1.6-1.9 g/cm
3
, and low viscous debris flow if the density is lower than 1.6 g/cm
3
.
Kang (1985a) reported that debris flow in the Jiangjia Ravine occurs during or after rainstorms in summer
and typically begins with a torrential flood. Following erosion of the gully bed the flood develops into a
flow with a high solids concentration in 10-20 minutes. The concentration of solid material reaches
100-160 kg/m
3
, or and the density of the flowing mixture is about 1.1 g/cm
3
. Then the flow develops
further into a low-viscous and subviscous debris flow in a short time and the density of the flowing
mixture increases from 1.1 g/cm
3
to 1.9 g/cm
3
. The highlight of the process is the formation of an
intermittent viscous debris flow when the density reaches 1.9-2.3 g/cm
3
. A series of debris flow waves
rush downstream one after another. This process lasts 2-3 hours in general, during which 80-100 waves
pass through the channel. Each wave lasts only about 20-30 seconds. Between the waves the mixture
stopped flowing for 1-5 min. Then the flow transforms into sub-viscous debris flow and low-viscous
debris flow following dilution of the mixture.
4.3.3.2
Intermittence of Viscous Debris Flow
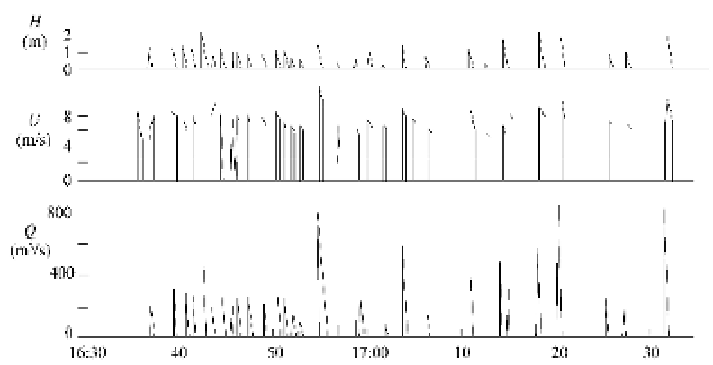
Figure 4.43 shows the intermittent process of a viscous debris flow (Kang, 1985a or b). One can see from
the figure that the discharge and velocity are intermittent and the velocity of the debris flow wave was as
high as 8 m/s. The viscous debris flow develops into a series of roll waves as the specific weight increases
to 1.8 g/cm
3
or the weight concentration of solids reaches 1,280 kg/m
3
. Each wave exhibits a front head
composed of large gravel and stones, a body with relatively uniform depth and surface velocity, and a rear
of small depth, as shown in Fig. 4.44. Between two waves there is no-flow but still a solid-liquid mixture.
Fig. 4.43
A typical viscous debris flow process in the Jiangjia Ravine from 16:30 to 17:30 (after Kang, 1985a).
H
=
the depth,
Q
= discharge, and
U
= propagation velocity of the debris flow wave measured at the Dongchuan Station

Search WWH ::

Custom Search