Environmental Engineering Reference
In-Depth Information
flow of low stream power; (b) in flows of high stream power the channel bed developed into step-pools;
(c) dry bed-form after the experiment; and (d) a hydraulic jump at a step-pool section.
Table 3.5 lists Manning's roughness coefficient
n
and the rate of bed load transportation during
different stages of bed form development, in which the hydraulic radius was measured directly from the
average depth; the average velocity was calculated from the discharge and average depth; Manning's
roughness coefficient,
n
, was calculated using Manning's formula, which represents the resistance of the
bed to the flow; and the rate of bed load transportation per width was measured using a sediment
trapping basket at the downstream end of the flume, which is, in fact, the rate of erosion from the channel
bed per time in the case of no sediment supply from the entrance.
Table 3.5
Manning's roughness coefficient
n
and rate of bed load transportation during different stages of bed form
d
evelopment
Stage of bed form
development
Rate of bed load
transport per width
g
b
(kg/min.m)
Hydraulic
radius
R
(cm)
Average
velocity
U
(m/s)
Manning's
roughness
n
No
1
Developing
0.87
0.718
0.0186
15.0
2
1.25
0.500
0.0341
5.4
Developing
3
0.96
0.651
0.0219
12.3
Armor layer
4
1.28
0.488
0.0354
4.6
Armor layer
5
1.53
0.408
0.0477
0.73
Step-pool system
6
1.66
0.377
0.0547
0.04
Step-pool system
7
1.64
0.377
0.0545
0.05
Step-pool system
During the developing stage (Stage
Ē
in Fig. 3.33) the channel bed was eroded by the flow and the
measured rate of bed load transportation was high. Manning's roughness coefficient,
n,
varied with the
adjustment of the bed form. In the second stage (Stage
ē
) an armor layer formed after a period of
erosion and the resistance became larger because the bed surface was rough. In the meantime the rate of
bed erosion and sediment transportation to the downstream end was reduced. The armor layer could not
remain long because the sediment-starved flow initiated motion of the individual coarse particles. These
coarse particles were stopped by some even bigger particles and accumulated there building a structure.
More particles overlapped and formed steps at several places. The flow over the steps scoured the
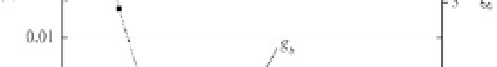
Fig. 3.33
Variation of Manning's roughness coefficient,
n,
and the rate of sediment transportation per width,
g
b
,
during the three stages of channel bed development for a step-pool system


Search WWH ::

Custom Search