Environmental Engineering Reference
In-Depth Information
E
W
= -650 t/km
2
yr
2
, and
c
1
and
c
2
are determined by the initial conditions:
V
(
t =
1978) = 0.076, and
E
(
t =
1978) = 7,243 t/km
2
yr.
The values of the parameters
a
,
c
,
b
, and
f
are the same as those given by Eq. (2.19) because the Heishuihe
watershed is in the watershed of the Xiaojiang River and the climate, morphology, and soil compositions
are the same. Equation (2.23) provides the theoretical solution of the vegetation and erosion processes, as
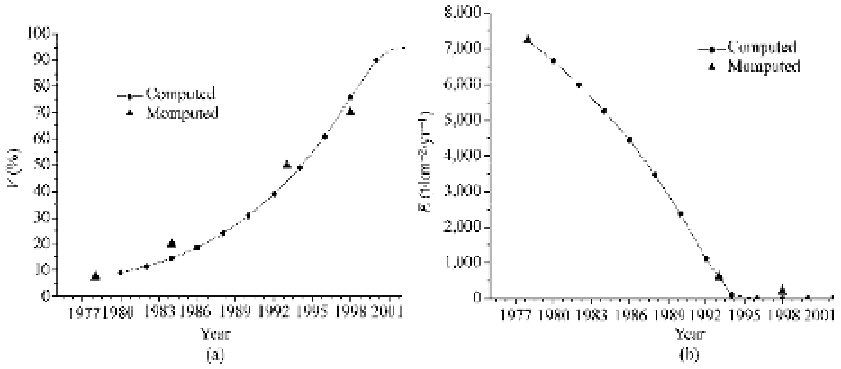
shown in Fig. 2.35. The theoretical curves agree well with the measurements. During the first 10 years
the vegetation cover developed slowly but the development accelerated during the second 10 years.
V
W
= 0.04 yr
-1
,
in which
0
0
Fig. 2.35
Comparison of the theoretical curves calculated with the same parameters as for the parent Xiaojiang
watershed with the real development process of (a) vegetation cover and (b) erosion rate for the Heishuihe watershed
(after Wang et al., 2003a)
Another example is the Shengou watershed near the suburbs of Dongchuan City. This small watershed
experienced extremely high rates of erosion and degradation of vegetation in the 1950s-1970s. Debris
flow damaged the farm fields and factories, and even invaded the downtown of the city many times. The
erosion rate was 8,000 t/km
2
yr and the vegetation cover was only 6% in the 1970s. The government launched
the erosion control and reforestation project in 1976. People constructed more than 200 check dams and
planted trees to green the hills at a rate of 4% per year. The erosion rate was reduced by 700 t/km
2
yr
every year. After 20 years the vegetation cover increased to 60% and the erosion rate reduced to less than
150 t/km
2
yr. No debris flow occurred anymore.
The ecological stresses and the solution of the vegetation-erosion equations are the same as those for
the Heishuihe watershed but only the values of the initial conditions and the coefficients of the stresses
are different, they are:
V
(
t
= 1976) = 0.06,
E
(
t
= 1976) = 8,000 t/km
2
yr
E
W
= -700 t/km
2
yr
2
.
The values of the parameters
a
,
c
,
b
, and
f
are the same as those given by Eq. (2.19). Figure 2.36 shows
the comparison between the theoretical solution and the measurements. The agreement of the theory and
data proves again that the vegetation-erosion dynamics is a powerful tool for prediction of the vegetation
evolution of areas of known, regionally consistent climate, morphology, and soil composition. Again the
result shows slow development of the vegetation cover in the first 10 years but much faster development
in the second 10 years, implying the effort of reforestation and erosion control must be a long-term
strategy for effective improvement of the vegetation.
The agreement between the data and the theoretical curves proves that the parameters
a
,
c
,
b
, and
f
are
independent of the stresses and initial conditions. Once the parameters are determined for a watershed or
V
W
= 0.04 yr
-1
,
0
0

Search WWH ::

Custom Search