Environmental Engineering Reference
In-Depth Information
fV
(
n
a E
)
am
am
W
W
mt
m t
nt t
(
)
Et
( )
c
1
e
c
2
e
'
(1979)
e
(2.21b)
0
0
1
2
0
1
2
c
c
(
nand f
)(
)
in which
t
is the time in years from the initiation of this study (1954 in this case) and
t-t
0
is the time from
1979,
m
1
and
m
2
are given by Eq. (2.17), and
c
1
and
c
2
are determined by the initial conditions.
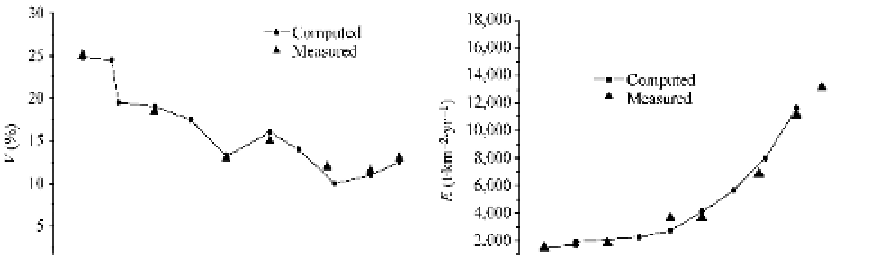
The solution of the vegetation-erosion dynamics, given by Eq. (2.19), provides the evolution process of
vegetation and erosion, as shown in Fig. 2.34. The theoretical solution agrees well with the measured data.
The values of the parameters shown in Eq. (2.19) are for the Xiaojiang watershed and they are the climate,
soil, and morphology and are independent of the human caused stresses. Therefore, the values can be applied
to sub-watersheds within the area, within which the climate, morphology, and soil composition are the same
but the human caused stresses may be quite different from those on the Xiaojiang watershed as a whole.
Fig. 2.34
Theoretical solution for the variation of (a) vegetation (
V
) and (b) erosion rate (
E
) for the Xiaojiang
watershed in comparison with measured data (after Wang et al., 2003a)
The Heishuihe River is a tributary of the Xiaojiang River. It is 3.9 km long with drainage area of 9.94 km
2
.
In this watershed debris flow has occurred frequently and the erosion rate was high in the 1960s and 1970s.
The watershed was selected as a demonstration area of an intensive erosion control and reforestation
project. The vegetation cover was only 7.6% and the soil erosion rate was 7,243 t/(km
2
·
yr) before 1978
when the intensive erosion control project started. The major strategies of the project were reforestation
and controlling erosion with check dams. The hills and slopes were reforested at a rate of 4% per year, and
the erosion rate was reduced by the construction of a series of dams by 650 t/(km
2
·
yr) every year. After
20 years the watershed changed its landscape completely. The vegetation cover increased to 70% and the
erosion rate is reduced to less than 200 t/(km
2
·
yr).
The development of vegetation and variation of erosion can be described directly by the theoretical
solution of the vegetation-erosion dynamics, in which the values of
a
,
c
,
b
,and
f
are directly taken from
Eq. (2.19). The stresses are constant
1
(t/km
2
·
yr
2
). In this case the stresses are
Vt
W
( )
0.04yr
,
Et
W
()
650
Vt
()
V
,
Et
()
E
(2.22)
W
W
W
W
0
0
Substituting Eq. (2.22) into Eqs. (2.14) and (2.15), and integrating yields
bV
cE
W
W
mt
m t
Vt
()
c
e
c
e
(2.23a)
0
0
1
2
1
2
ab
cf
f V E
am
am
W
W
Et
()
c
1
e
mt
c
2
e
m t
(2.23b)
0
0
1
2
1
2
c
c
ab
cf


Search WWH ::

Custom Search