Information Technology Reference
In-Depth Information
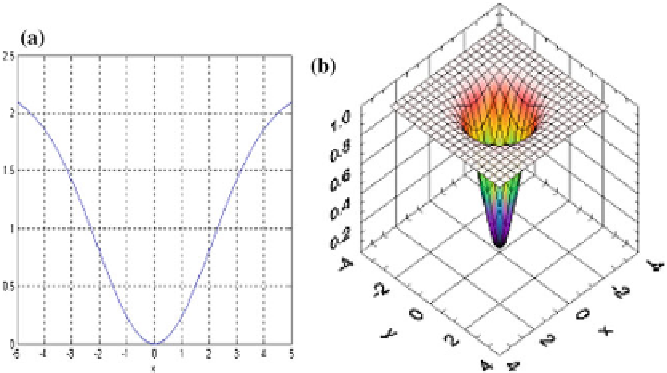
Fig. 3.14
a
Plane and
b
Surface graphs Welsch error function
3.3.2.9 Welsch Error Function
This function reduces the influence of large errors. The typical value of the tuning
constant is
c
=
2
.
9846. The Welsch error function is given by
1
exp
2
e
i
c
c
2
2
E
=
−
−
(3.23)
n
The complex Welsch EF is defined to be
1
exp
ʵ
i
ʵ
i
c
2
c
2
2
E
=
−
−
(3.24)
n
where
n
is the number of outputs and the tuning constant c was set to the Welsch
constant. The plane and surface plots of Welsch EF are given in Fig.
3.14
a and b
respectively.
3.3.3 Properties of Complex Error Functions
Practical data is prone to outliers resulting from observational or experimental errors.
If the quadratic EF were used to analyze data containing outlier points, the optimiza-
tion scheme would result in estimates that depend significantly on the outliers as
the quadratic EF assigns greater cost to far off points. A different error function, for
example an absolute EF can perform better optimization than quadratic as the cost
Search WWH ::

Custom Search