Environmental Engineering Reference
In-Depth Information
14.3 Modeling of Wind Turbines
14.3.1 Power Curve of a Wind Turbine
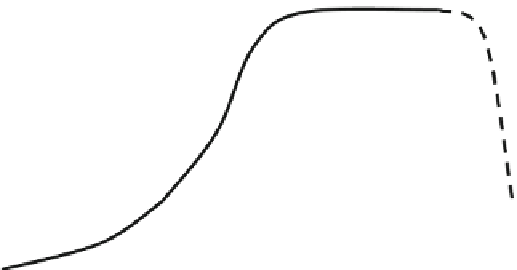
A qualitative power curve of a variable-speed wind turbine is shown in Fig.
14.10
.
This graph presents the actual power P supplied by the wind turbine to the grid
versus the undisturbed upstream wind speed v
1
. Two main areas (below and above
rated power P
r
) and four regions (Regions 1 through 4) divide the graph.
Below rated power (v
1
\ V
r
) the wind turbine produces only a fraction of its
rated power, and therefore, an optimization strategy to capture the maximum
amount of energy at every wind speed needs to be performed. Above rated power
(V
r
\ v
1
) the wind speed has more power than the rated power, and a limitation
control strategy to generate only the rated power is required. The four regions of
the power curve present the following characteristics:
• Region 1. The objective in this region is to obtain the maximum efficiency. This
is usually done by means of controlling the rotor speed X
r
by changing
the electrical torque T
g
, to compensate the wind speed variations and keep the
turbine at the maximum aerodynamic power coefficient C
pmax
(MPPT: Maxi-
mum Power Point Tracking). The power P supplied by the wind turbine to the
grid follows the expression:
P
¼
P
g
g
c
¼
1
2
q A
r
C
p
v
1
g
g
g
c
¼
T
r
X
r
g
g
g
c
¼
P
a
g
g
g
c
ð
14
:
7
Þ
Rated wind
speed
v
r
Power (
P
)
Below rated
- power optimisation
Above rated
- power limitation
P
r
Region 4
Region 3
Pitch control:
stability,
disturbance
rejection
Extended mode:
load limitation,
partial power
Region 1
Torque control:
maximum
aerodinamic
efficiency
Region 2
Tra nsition
:
good
efficiency,
smooth
transients
v
cut
v
12
v
r
v
34
v
cut
Wind
speed
(
v
)
in
off
Fig. 14.10 Power curve of a variable-speed wind turbine (see [
2
])