Environmental Engineering Reference
In-Depth Information
(a)
Fixed base
Semi-active control
(b)
Fixed base
Semi-active control
(c)
(d)
Desired
MR force
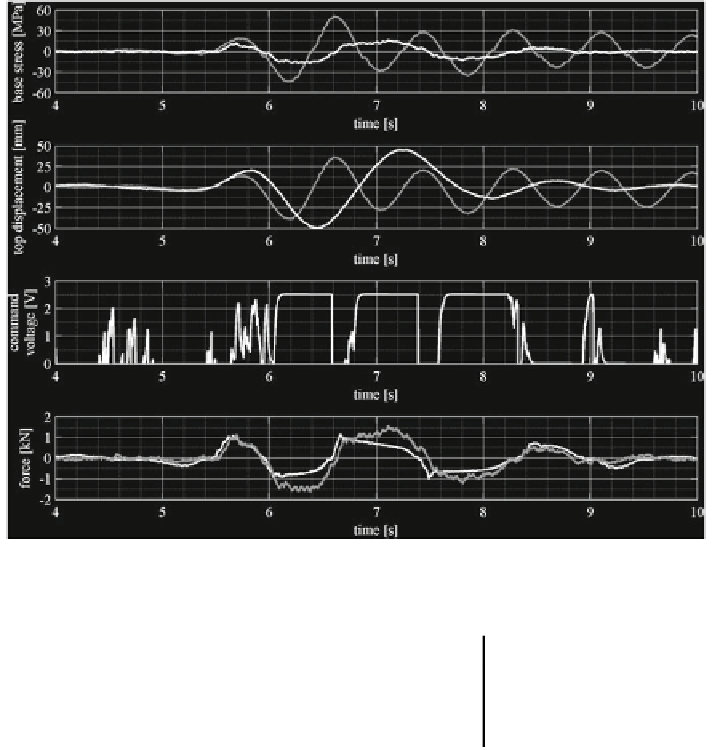
Fig. 13.17
EOG load case: SA control via the CLES controller and comparison with the FB case
Table 13.2 EOG input: peak
response of the FB structure
and of the SA case using the
CLES controller
Case max|r| max|x|
Fixed base 51 MPa 39 mm
Semi-active CLES 17 MPa 50 mm
FB ? SA
-67 % +28 %
Percentage variation from the first to the second condition
EOG accelerogram, whereas diagrams (c), (d), and (e) are focused on a 2 s time
window (5.5-7.5 s), so highlighting the behavior of the uncontrolled and con-
trolled tower during the strongest phase of the base excitation.
It can be observed that the top displacement always resulted to be within the
limit of 46 mm, therefore only conditions in Eqs.
13.41
and
13.42
occurred.
Figure
13.18
c-e highlights the position of two instants of time (6.19 and 6.77 s)
where the condition of Eq.
13.42
and of Eq.
13.41,
respectively occurred, causing
a switch-off and a switch-on of the current in the devices. Looking again at
Fig.
13.18
, the reduction of stress and displacement compared to FB case (except
for the peak displacement) is quite evident. In particular, around the strong phase
of the excitation, the control algorithm, also thanks the promptness of the control