Environmental Engineering Reference
In-Depth Information
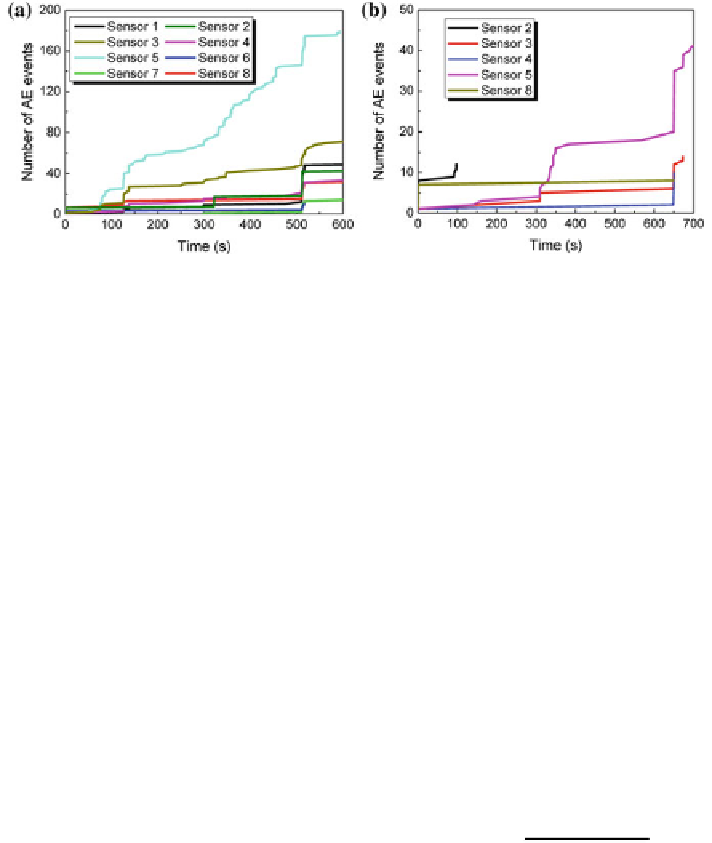
Fig. 9.28 Acoustic emission arrival times and magnitudes load: a the second loading stage, b the
first loading stage.
and second loadings, the closest sensor to the actuator, sensor 2, was destroyed as
the actuator was repositioned and had to again be bonded.
Overall, it seems the odd numbered sensors counted more AE events, which
may have occurred due to the geometry of the blade; the foreword positions of
these sensors along the airfoil made the thickness of the blade at those points larger
than at the even positions. The blade was also hollow at the odd locations, which
may have affected how the waves at the recorded frequencies moved across the
blade's surface and thus affected the AE counts.
9.4.3 Fractal Theory-Based Damage Detection Method
and Results
In this section, a damage acuteness index based on fractal theory is presented. The
length of time series of PZT signal,X
k
, can be defined as follows [
56
]:
8
<
9
=
ð
N
m
Þ
=
k
½
L
m
ð
k
Þ¼ ð
X
N
1
½ð
N
m
Þ
=
k
:
k
j
ð
X
ð
m
þ
ik
Þ
X
ð
m
þð
i
1
Þ
k
Þ
jÞ:
=
k
:
;
i
¼
1
ð
9
:
17
Þ
where [] denotes the Gauss' notation and both k and m are integers, which indicated
the initial time and the interval time, respectively. For a time interval equal to k,we
get k sets of new time series and the certain length of the curve of the signal.
We define the length of the curve for the time interval k, \ L(k) [ , as the
average value over k sets of L
m
(k). If \ L(k)[ak
FD
, then the curve is fractal with
the dimension FD. As shown in Fig.
9.29
, the signal of PZT sensor has obvious
fractal feature because the straight line is fitted to the points by the least-square
method.