Environmental Engineering Reference
In-Depth Information
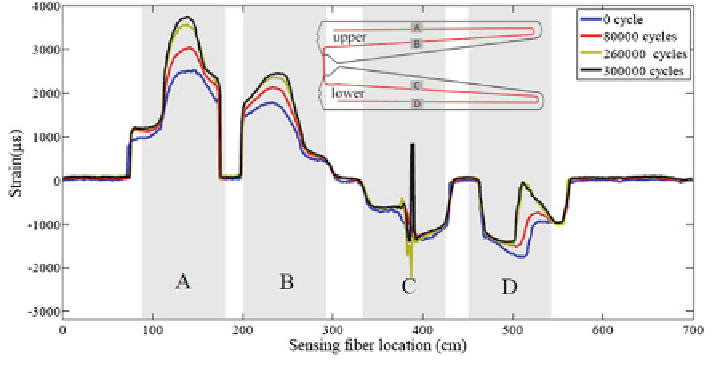
9.3.3.2 Damage Detection Results of the DPP-BOTDA System
The strain distributions of the wind turbine blade along the optical fibers, which
were obtained by the DPP-BOTDA system at different fatigue cycle counts, are
presented in Figs.
9.20
and
9.21
. The horizontal axis is the distance from one end
of the optical fiber and the vertical axis is the longitudinal strain along the optical
fiber. The test results consist of four sensing segments A, B, C, and D. Segments A
and D represent the strain distributions obtained by the optical fibers near the
leading edge. Segments B and C represent the strain distributions obtained by
the optical fibers near the trailing edge. The zero parts between segments are the
turnarounds of the strain-free fibers. In undamaged state (0 cycle), the test results
reveal that the strain near the leading edge (A, D), both the tensile strain on the
upper surface and compressive strain on the lower surface, are higher than those
near the trailing edge. The high strain region of the blade was at 70-80 cm from
the root. These characteristics indicate severe fatigue damage near the leading
edge at high strain region. Soon after the fatigue test started (starting at about
40,000 cycles), a multitude of fine gel-coat cracks developed on the upper surface,
and the cracks were most apparent at the 70-80 cm span of the blade which was
the high strain region of the blade. The gel-coat cracks reduced the local flexural
stiffness and resulted in a higher tensile strain near the damaged region. As shown
in the test results of strain distributions at 80,000 cycles, the strain changed sig-
nificantly in the high strain region, especially near the leading edge side. Hence,
these test results demonstrated the effectiveness of the DPP-BOTDA sensing
system in the initial fatigue damage detection location. From 80,000 to
260,000 cycles, these gel-coat cracks progressed in length and gap width. Some of
the gel-coat cracks near the high strain region turned to larger visible cracks. These
cracks further reduced the local flexural stiffness and resulted in a much higher
Fig. 9.20 The strain distributions at different fatigue cycle count obtained by Optical Fiber 1