Environmental Engineering Reference
In-Depth Information
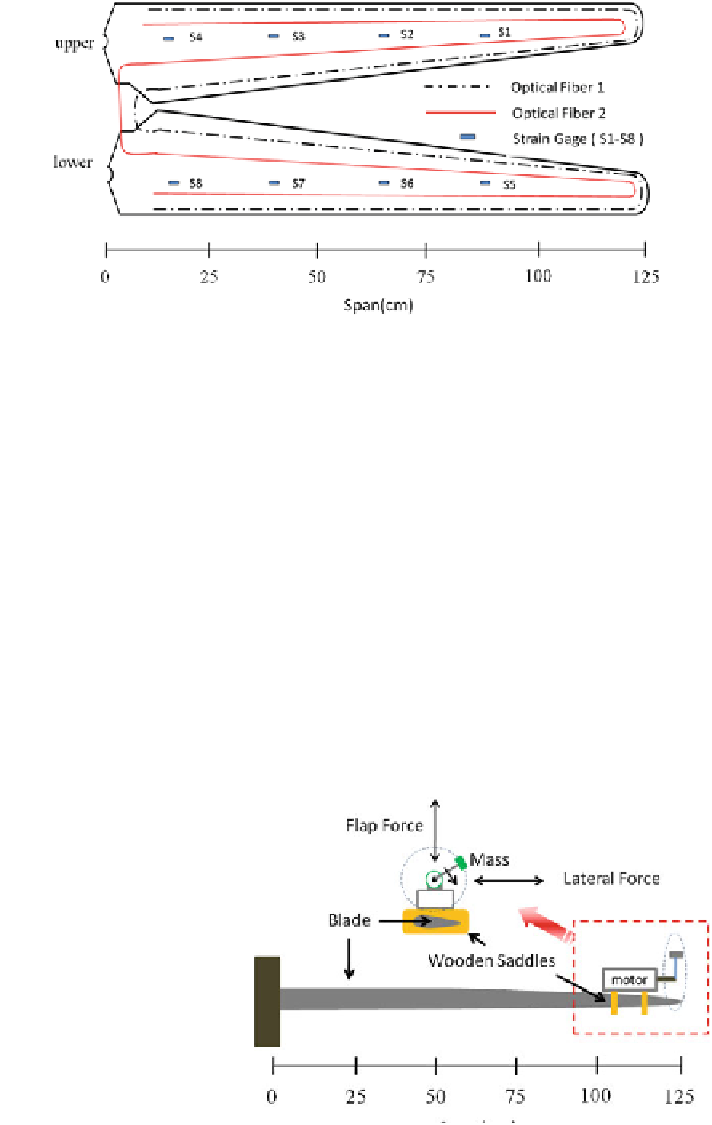
Fig. 9.15 Layout of optic fiber sensors and strain gauges
blade along with optical fiber to validate the measurement accuracy of the dis-
tributed sensing and continuously monitor the condition of the blade. Hence, the
measurement taken is stable and reliable during the blade fatigue test process.
9.3.2.2 Summary of Test Procedure
Figure
9.16
shows the fatigue test loading system for wind turbine blade based on
single-axis resonance method [
53
]. An electric motor, connected with a 1 kg mass,
was mounted approximately at 115 cm from the blade root using wooden saddles.
The motor was driven to excite the first flap frequency and induce a cyclic load in
the blade. The loading cycle frequency is about 2.6 c/s. The initial strain ampli-
tudes of the fatigue loading along the spanwise axis on both side of the blade are
shown in Fig.
9.17
.
Fig. 9.16 Schematic of the
fatigue loading system