Environmental Engineering Reference
In-Depth Information
Bode Diagram
-40
Plant
C1
C2
-50
-60
-70
-80
-90
-100
-110
-120
10
-3
10
-2
10
-1
10
0
10
1
10
2
Frequency (Hz)
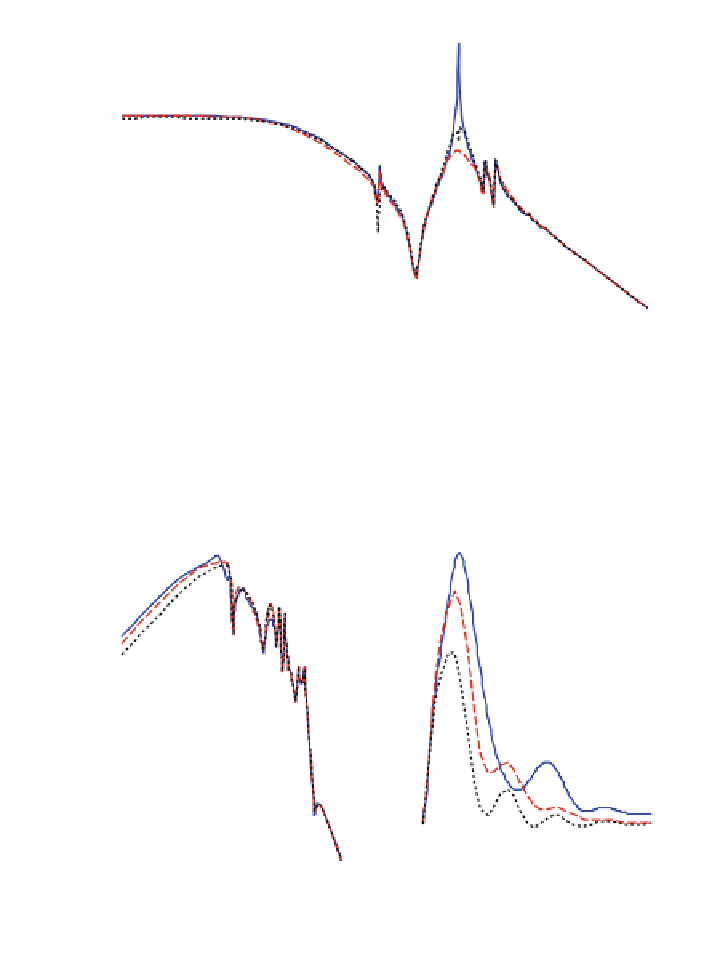
Fig. 5.16
Bode diagram of the plant ''From: Generator Torque To: Generator Speed''
Bode Diag
ra
m
W i n d Sp e e d U n i t St e p Re sp o n se
20
4
C1
C2
C3
3.5
0
3
-20
2.5
2
-40
1.5
-60
1
-80
0.5
0
-100
-0.5
10
0
0
5
10
15
20
Time (s)
Frequen cy (Hz)
Fig. 5.17
Response of the generator speed for a wind input
control system is analyzed to see the control influence in the frequency domain
representation of these signals.
• The load analysis to see the extreme and fatigue load mitigation achieved with
these control strategies. The rain flow counting algorithm [
47
,
48
] is used to
carry out the load equivalent analysis to determine the fatigue damage on the