Environmental Engineering Reference
In-Depth Information
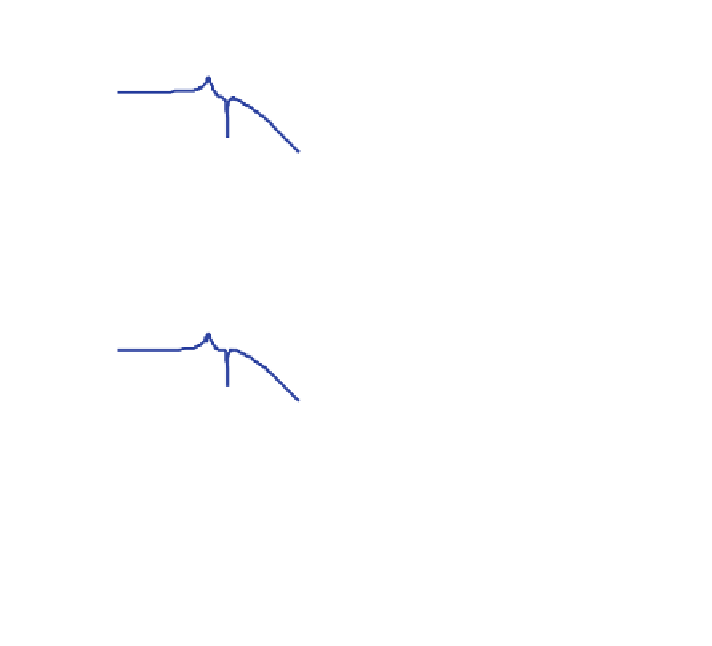
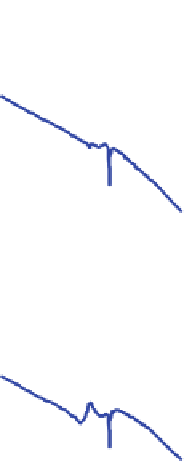
Bode Diagram
From: a
Tss
(m/s
2
)
From: M
tilt
(Nm)
From: M
yaw
(Nm)
-50
-100
-150
-200
-250
0
-50
-100
-150
-200
0
0
0
10
10
10
Fre q uenc y (Hz)
Fig. 5.13
Bode diagram of the individual pitch H
?
control
Fig. 5.14
Diagram of the individual pitch control strategy
0
@
1
A
a
Tss
ð
k
Þ
M
tilt
ð
k
Þ
M
yaw
ð
k
Þ
x
ð
k
þ
1
Þ¼
A
ipc1
x
ðÞþ
B
ipc1
0
@
1
A
ð
5
:
18
Þ
!
a
Tss
ð
k
Þ
M
tilt
ð
k
Þ
M
yaw
ð
k
Þ
b
tilt
ð
k
Þ
b
yaw
ð
k
Þ
¼
C
ipc1
x
ðÞþ
D
ipc1