Information Technology Reference
In-Depth Information
b
a
2
100
1
50
0
0
−1
−50
−2
−100
−2
0
2
−2
0
2
x
1
x
1
c
d
100
6
50
4
0
2
−50
0
−100
−2
−2
0
2
−20
−10
0
x
2
p
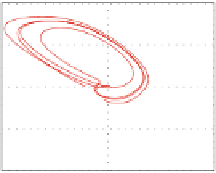
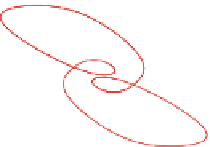
Fig. 2.23
(
a
)-(
c
) Phase diagrams showing limit cycles of the Hopfield model, (
d
) Lyapunov
exponents vs varying parameters
of oscillators have been given. Moreover, using mathematical models of oscillators
and biological neurons the following properties have been analyzed: phase diagram,
isoclines, attractors, local stability, bifurcations of fixed points, and chaos properties.