Information Technology Reference
In-Depth Information
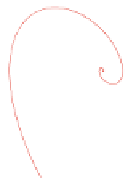
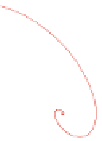
Fig. 2.9
Phase diagram of
state variables x
1
, x
2
of a
second order linear
autonomous system with real
eigenvalues
1
>
2
>0
3
2
1
0
−1
−2
−3
−30
−20
−10
0
10
20
30
x
1
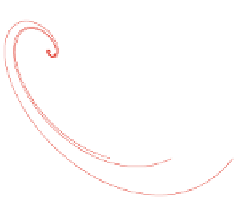
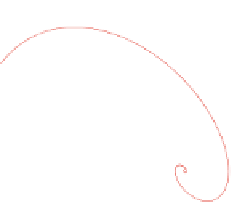
Fig. 2.10
Phase diagram of
state variables x
1
, x
2
of a
second order linear
autonomous system with
complex stable eigenvalues
15
10
5
0
−5
−10
−15
−10
−5
0
5
10
X
1
2.4.2
Multiple Equilibria for Nonlinear Dynamical Systems
A nonlinear system can have multiple equilibria as shown in the following example.
Consider, for instance, the model of a pendulum under friction
x
1
D x
2
x
2
D
(2.51)
g
l
sin.x
1
/
K
m
x
2
The associated phase diagram is designed for different initial conditions and is
given in Fig.
2.14
.
For the previous model of the nonlinear oscillator, local linearization round
equilibria with the use of Taylor series expansion enables analysis of the local