Information Technology Reference
In-Depth Information
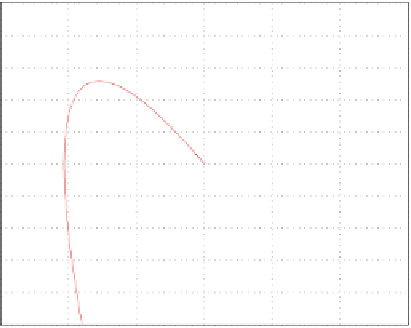
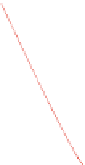
Fig. 2.7
Phase diagram of
initial state variables x
1
, x
2
of
a second order linear
autonomous system with
negative eigenvalues, where
1
<
2
<0
10
8
6
4
2
0
−2
−4
−6
−8
−10
−15
−10
−5
0
5
10
15
x
1
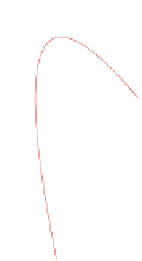
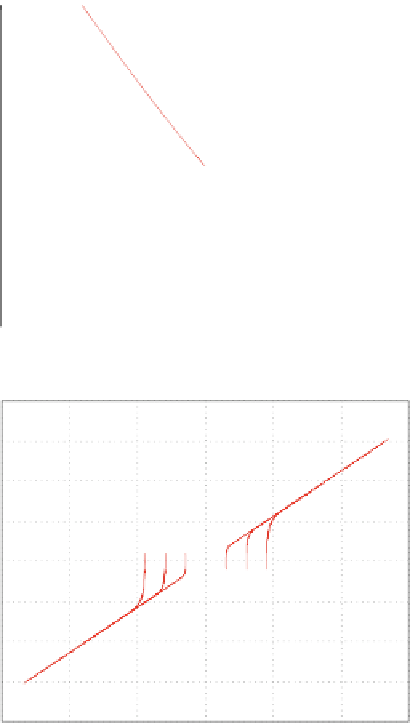
Fig. 2.8
Phase diagram of
initial state variables x
1
, x
2
of
a second order linear
autonomous system with real
eigenvalues, where
1
>0>
2
2
1.5
1
0.5
0
−0.5
−1
−1.5
−2
−30
−20
−10
0
10
20
30
x
1
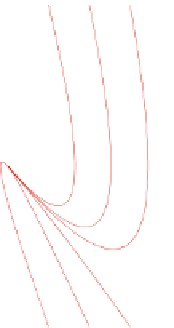
Case 2
: Complex eigenvalues:
Typical phase diagrams in the case of stable complex eigenvalues are given in
Fig.
2.10
.
Typical phase diagrams in the case of unstable complex eigenvalues are given in
Fig.
2.11
.
Typical phase diagrams in the case of imaginary eigenvalues are given in
Fig.
2.12
.
Case 3
:MatrixA has non-zero eigenvalues which are equal to each other. The
associated phase diagram is given in Fig.
2.13
.