Information Technology Reference
In-Depth Information
a
b
1.4
0.4
0.35
1.2
0.3
1
0.25
0.8
0.2
0.15
0.6
0.1
0.4
0.05
0.2
0
0
−0.05
0
10
20
30
40
50
60
0
10
20
30
40
50
60
q
q
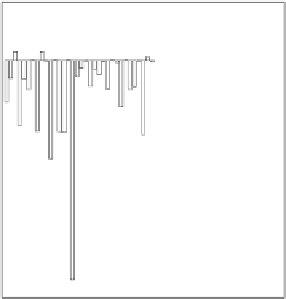
Fig. 12.28
Temperature's time variation—profile 1: (
a
) Amplitude of the spectral components of
the temperature signal in the fault free case (
red bar line
) and when a fault had taken place (
yellow
bar line
)(
b
) differences in the amplitudes of the spectral components between the fault-free and
the faulty case (
green bar line
)
b
a
1.5
0.1
0.05
0
−0.05
1
−0.1
−0.15
−0.2
0.5
−0.25
−0.3
−0.35
0
−0.4
0
10
20
30
40
50
60
0
10
20
30
40
50
60
q
q
Fig. 12.29
Temperature time variation—profile 2: (
a
) Amplitude of the spectral components of
the temperature signal in the fault free case (
red bar line
) and when a fault had taken place (
yellow
bar line
)(
b
) differences in the amplitudes of the spectral components between the fault-free and
the faulty case (
green bar line
)
12.9
Conclusions
In this chapter FNN that use the eigenstates of the quantum harmonic oscillator as
basis functions have been studied. The proposed neural networks have some inter-
esting properties: (a) the basis functions are invariant under the Fourier transform,