Information Technology Reference
In-Depth Information
a
b
120
400
100
300
80
200
60
100
40
20
0
0
−100
−20
−200
−40
−300
−60
0
5
10
15
20
0
5
10
15
20
t
t
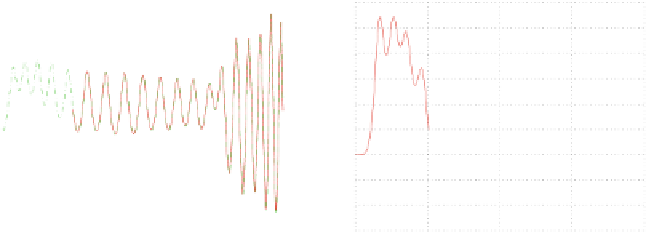
Fig. 6.4
Test case 1: estimate (
dashed green line
) and real value (
red continuous line
)(
a
)of
.x
1
;t/at grid point 1 (
b
)of.x
2
;t/at grid point 2
a
b
100
80
80
60
60
40
40
20
20
0
0
−20
−20
−40
−40
−60
0
5
10
15
20
0
5
10
15
20
t
t
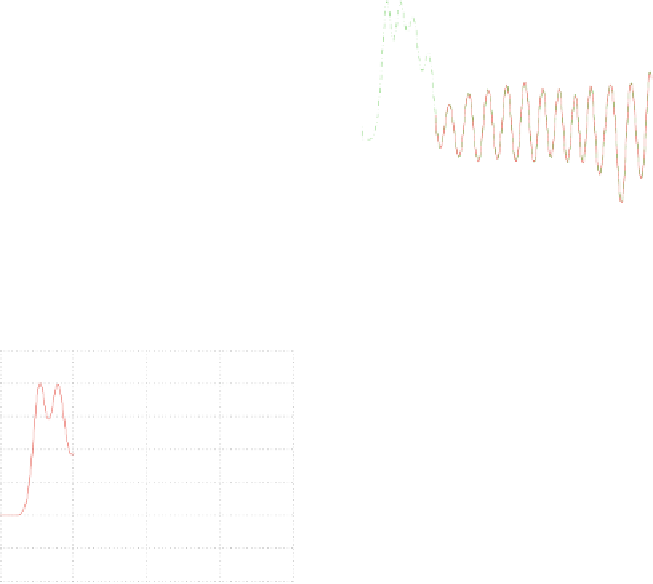
Fig. 6.5
Test case 1: estimate (
dashed green line
) and real value (
red continuous line
)(
a
)of
.x
5
;t/at grid point 5 (
b
)of.x
7
;t/at grid point 7
a
b
40
40
30
30
20
20
10
10
0
0
−10
−10
−20
−20
−30
−30
−40
−40
−50
−50
0
5
10
15
20
0
5
10
15
20
t
t
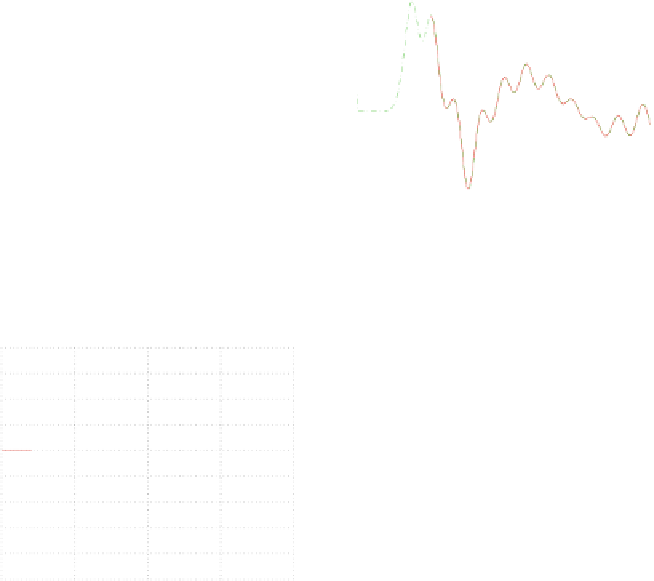
Fig. 6.6
Test case 1: estimate (
dashed green line
) and real value (
red continuous line
)(
a
)of
.x
1
5;t/ at grid point 15 (
b
)of.x
20
;t/at grid point 20