Information Technology Reference
In-Depth Information
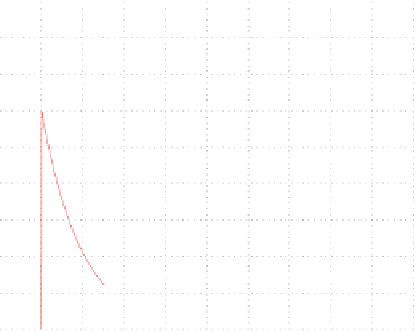
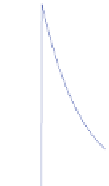
Fig. 4.4
Model of the
variation of synaptic
conductances in the case of a
single pre-synaptic spike: (
a
)
AMPA
(
blue
)and(
b
)
GABA
A
(
red
)
1.6
1.4
1.2
1
0.8
0.6
0.4
0.2
0
0.02
0.04
0.06
0.08
0.1
0.12
0.14
0.16
0.18
0.2
time (sec)
g.t/ Dg
P
k
a.t t
k
/ Dg
z
.t/
(4.3)
where
a
d
a
r
a
r
a
d
.e
a
d
t
e
a
r
t
/
a.t/ D
(4.4)
or a.t/ D a
d
e
a
d
t
. As far as parameter
z
.t/ is concerned its variation in time is
given by the differential equation
z
00
C .a
r
C a
d
/
z
0
C a
r
a
d
z
D 0
(4.5)
Another manner for modelling conductivity in the synapse is to use
g.t/ Dgs.t/
(4.6)
where s.t/ denotes the fraction of the open channel which satisfies the relation
ds
dt
D a
r
ŒT.1 s/ a
d
s
(4.7)
where ŒT is the concentration of the transmitter coming from the pre-synaptic
neuron and released at the post-synaptic neuron (Fig.
4.4
).
The time is set at t D t
0
. Then the concentration ŒT becomes equal to T
max
and
at time instant t
1
it returns to zero. Then
s.t t
0
/ D s
1
C .s.t
0
/ s
1
/e
.tt
0
/=t
0
(4.8)