Environmental Engineering Reference
In-Depth Information
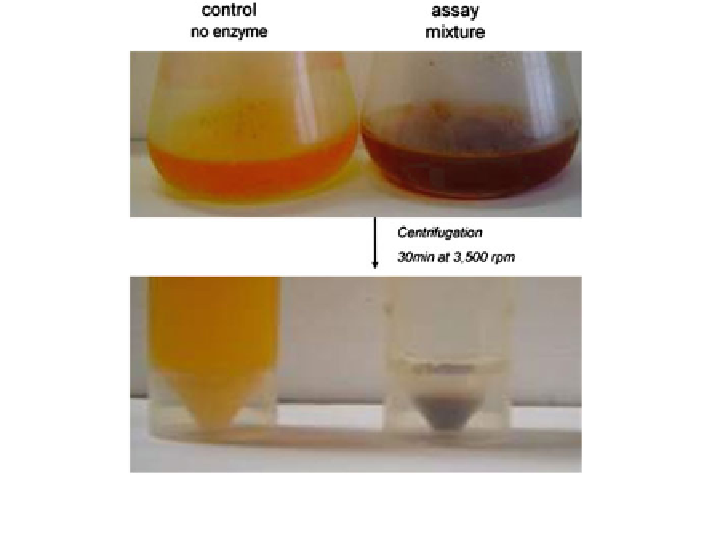
Fig. 3 Reaction mixtures: control and in the presence of enzyme after 24 h, showing the
darkening of the enzymatic treated solution, most likely due to the high insolubility of the
oligomeric products formed
2.3 Anthraquinonic Dyes Biotransformation
The transformation of the anthraquinonic model dye acid blue 62 (AB62)
was carried out using CotA-laccase (Pereira et al.
2009b
, Fig.
5
a) or Lac3 from
Trametes sp. C30 following the research initiated in Sophie Vanhulle group
(Trovaslet et al.
2007
; Vanhulle et al.
2008a
,
b
). The degradation of AB62 resulted
in a decrease in the intensity of the dye absorption bands, at
λ
max
= 600 and 630 nm,
along with an increase in absorption around 500 nm due to the formation of reddish
biotransformation products (Vanhulle et al.
2008a
).
The time course of the biotransformation of AB62 was additionally monitored
by HPLC (Fig.
5
b). The AB62 biotransformation resulted in a product with a R
t
of
13 min that appeared in the
rst minutes of reaction, although, as the reaction
proceeded, it decreased concomitantly with the appearance of a new product with R
t
of 50 min (Fig.
5
b). The CotA steady-state the catalytic ef
ciency (k
cat
/K
m
) for
AB62 oxidation is 5
×
10
3
M
−
1
s
−
1
around 2
-
3 fold lower when compared to other
fungal laccases, including Lac3 from Trametes sp. C30 (Klonowska et al.
2002
,
2005
; Vanhulle et al.
2008a
). The biotransformation products were identi
ed after
cation in the enzymatic reaction mixtures by NMR, MS/MS
n
, LC-MS and
GC-MS analysis. Using
1
H NMR and MS/MS
n
was possible to identify the
intermediate product DAAS (R
t
= 13 min) and the
puri
nal product of the reaction (4)
Search WWH ::

Custom Search