Environmental Engineering Reference
In-Depth Information
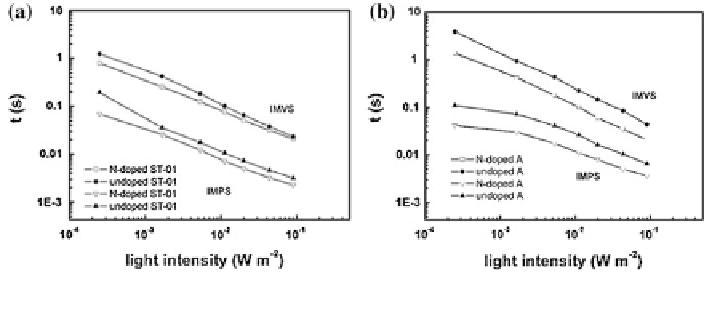
Fig. 13
IMPS time constants as functions of light intensity for N-doped and TiO
2
DSCs [
55
]
the N-A DSCs (Fig.
14
b). The electron lifetime can be calculated from the voltage
transients using Eq. (
1
)[
56
]:
1
s
e
¼
kT
e
dVoc
dt
ð
1
Þ
where k is the Boltzmann constant, T the absolute temperature, and e the positive
elementary charge. The calculated electron lifetimes are shown in Fig.
14
bas
functions of the open-circuit potential. Specifically, the lifetimes increased expo-
nentially when the voltage decreased. However, the lifetime of the N-A solar cell
was shorter than in the pure TiO
2
solar cells at U \ 0.6 V, but it was longer when
U [ 0.6 V.
The electron lifetime can also be deduced from EIS spectra. The electron
lifetime can be estimated by the maximum frequency in the EIS spectra as
described: s
e
= (2pf
max
)
-1
[
47
]. We conducted a linear fit of electron lifetime,
which tended to decrease as the N/Ti molar ratio increased (Fig.
14
c).
Therefore, the N-doping treatment can improve the electron transport but
decrease the electron lifetime in DSCs.
4.2 Electron Recombination
The difference between N-doped DSCs and TiO
2
DSCs with respect to their charge
transfer properties was also studied by EIS analysis [
47
-
49
]. The Nyquist diagram
typically features three semicircles in order of increasing frequency. These three
semicircles correspond to the following: the Nernst diffusion within the electrolyte,
electron transport at the oxide/electrolyte interface, and redox reaction at the
platinum counter electrode.
The main concerns in N-doped DSCs are the following: (1) the impedance due
to electron transfer from the conduction band of the mesoscopic film to triiodide
Search WWH ::

Custom Search