Environmental Engineering Reference
In-Depth Information
Table 1 Variation of proton conductivity, domain size and yield strength with s-MWCNT
composition and water content
Membrane composite
Proton
conductivity
(S cm
-1
)
Hydrophilic domain
size (nm)
Water
content (%)
Yield strength
(MPa)
Nafion 115
0.028
48
29.2
2.68
Recast Nafion
0.020
51
42.3
2.40
Naf-s-MWCNT 0.01 %
0.029
54
39.7
2.50
Naf-s-MWCNT 0.05 %
0.036
72
33.4
2.62
Naf-s-MWCNT 0.1 %
0.032
70
30.4
2.67
Naf-s-MWCNT 0.5 %
0.031
67
28.1
3.10
Naf-s-MWCNT 1 %
0.030
35
27.2
4.30
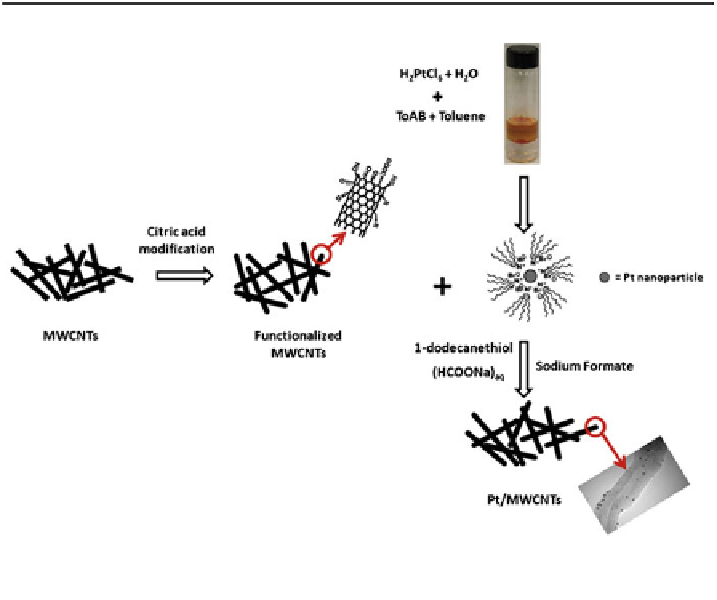
Fig. 4 Scheme for the surface modification of MWCNTs and Pt nanoparticles deposition
(adapted from Ref. [
66
] with permission from Elsevier publishing company)
chemical modification route [
66
]. By this method Pt nanoparticles of 1-3 nm are
stabilized at the same time maintaining a uniform Pt distribution due to the
anchoring groups present on the CNT surface (Fig.
4
). Interestingly, fuel cell
polarization plot with this catalyst shows a power density of 1,110 mW cm
-2
against 800 mW cm
-2
(5 cm
2
area) observed for a commercial catalyst. Further,
the activation loss observed at 50 mA cm
-2
is only 50 mV from the OCV for this
surface-modified process compared to that of 150 mV for unmodified CNTs.
However, with the carbon black it is much higher, which signifies the more effi-
cient use of CNTs in the catalyst layer of PEMFCs.


Search WWH ::

Custom Search